## Diagram Type: Flowchart
### Overview
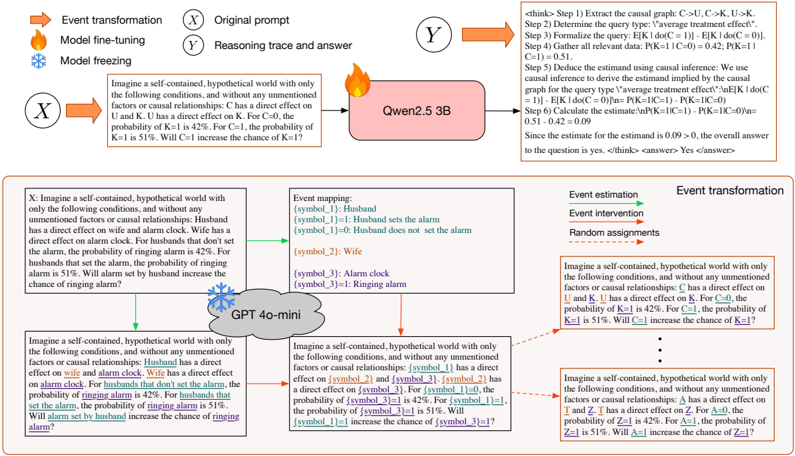
The image is a flowchart that illustrates the process of event transformation and reasoning. It includes steps for extracting a causal graph, determining a query, reasoning trace and answer, and fine-tuning a model.
### Components/Axes
- **Event transformation**: This step involves transforming an event into a new form.
- **Original prompt**: The initial question or statement that triggers the reasoning process.
- **Reasoning trace and answer**: The sequence of steps taken to arrive at the answer.
- **Model fine-tuning**: The process of adjusting the model to improve its performance on the given task.
- **Model freezing**: The process of keeping the model's parameters unchanged during training.
### Detailed Analysis or ### Content Details
The flowchart starts with the original prompt, which is then transformed into a causal graph. The causal graph is used to determine the query, which is then used to reason and arrive at the answer. The answer is then fine-tuned and frozen to improve the model's performance.
### Key Observations
The flowchart includes several steps, each with its own set of instructions and outcomes. The steps are interconnected, and the outcomes of one step are used as inputs for the next step.
### Interpretation
The flowchart demonstrates the process of event transformation and reasoning. It shows how an original prompt is transformed into a causal graph, which is then used to determine the query. The query is used to reason and arrive at the answer, which is then fine-tuned and frozen to improve the model's performance. The flowchart is a visual representation of the reasoning process and can be used to understand how the model works.