## Dual-Axis Line Chart: Performance Metrics vs. N-labels
### Overview
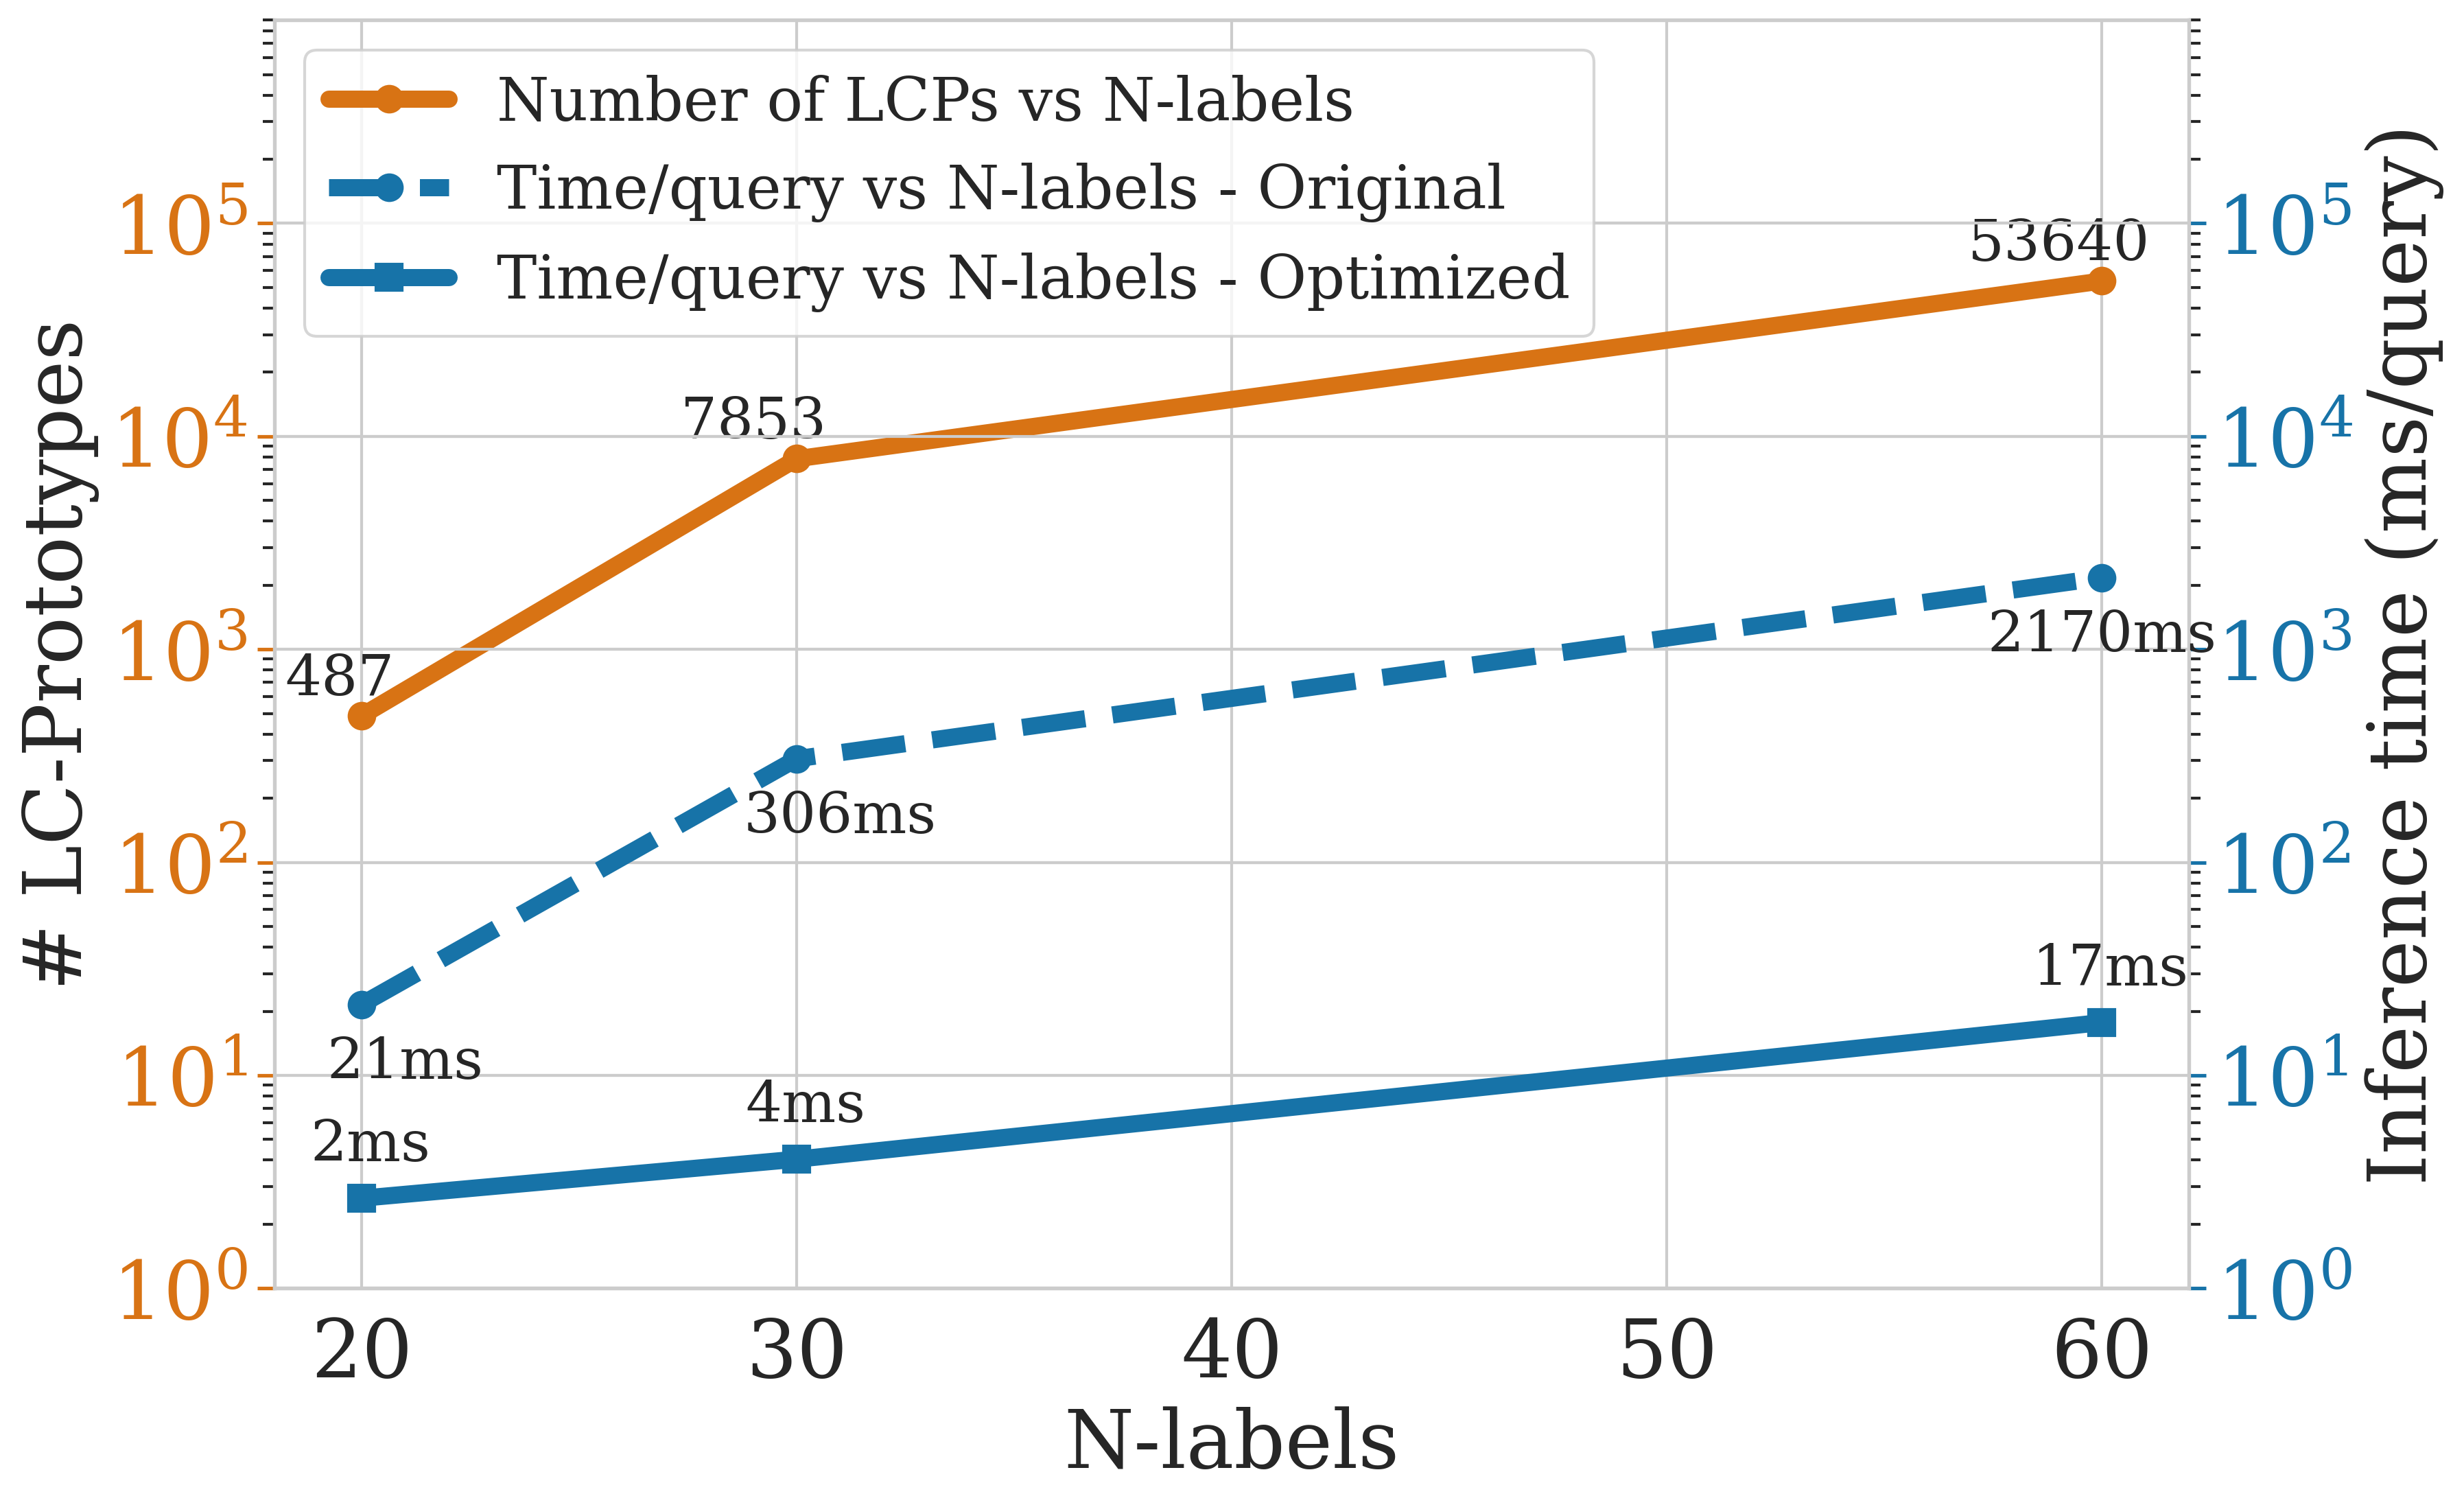
This chart illustrates the relationship between the number of labels ("N-labels") and two dependent variables: the number of "LC-Prototypes" (LCPs) and the "Inference time" (measured in ms/query). It compares the performance of an "Original" method against an "Optimized" method across a range of N-labels from 20 to 60.
### Components/Axes
* **X-axis:** "N-labels" (Range: 20 to 60).
* **Left Y-axis:** "# LC-Prototypes" (Logarithmic scale, $10^0$ to $10^5$, colored orange).
* **Right Y-axis:** "Inference time (ms/query)" (Logarithmic scale, $10^0$ to $10^5$, colored blue).
* **Legend (Top-Left):**
* **Orange line with circles:** "Number of LCPs vs N-labels"
* **Blue dashed line with circles:** "Time/query vs N-labels - Original"
* **Blue solid line with squares:** "Time/query vs N-labels - Optimized"
### Detailed Analysis
The chart displays three distinct data series plotted against N-labels. All axes are logarithmic.
**1. Number of LC-Prototypes (Orange Line)**
* **Trend:** Slopes sharply upward, indicating exponential growth in the number of prototypes as N-labels increase.
* **Data Points:**
* At N=20: 487 LCPs
* At N=30: 7,853 LCPs
* At N=60: 53,640 LCPs
**2. Time/query - Original (Blue Dashed Line)**
* **Trend:** Slopes upward, following a trajectory similar to the LCP growth, indicating that inference time is heavily dependent on the number of prototypes.
* **Data Points:**
* At N=20: 21ms
* At N=30: 306ms
* At N=60: 2,170ms
**3. Time/query - Optimized (Blue Solid Line)**
* **Trend:** Slopes upward, but at a significantly shallower angle than the "Original" line, indicating much slower growth in inference time relative to the increase in prototypes.
* **Data Points:**
* At N=20: 2ms
* At N=30: 4ms
* At N=60: 17ms
### Key Observations
* **Scalability Gap:** There is a massive divergence between the "Original" and "Optimized" inference times as N-labels increase.
* **Efficiency:** At N=60, the "Original" method takes 2,170ms, whereas the "Optimized" method takes only 17ms. This represents a speedup of approximately 127x.
* **Decoupling:** The "Optimized" line remains relatively flat compared to the "Original" line, suggesting that the optimization technique successfully decouples inference time from the raw count of LC-Prototypes.
### Interpretation
The data demonstrates a classic scalability bottleneck in the "Original" method: as the number of labels increases, the number of prototypes grows exponentially, which in turn causes the inference time to skyrocket.
The "Optimized" method is highly effective. Even as the number of prototypes grows from ~500 to over 50,000, the inference time only increases from 2ms to 17ms. This suggests the optimization likely involves a more efficient search algorithm, indexing strategy, or dimensionality reduction technique that prevents the system from having to perform a linear scan or exhaustive comparison against all prototypes during query time. The optimization is critical for making the system viable for larger datasets (N=60).