## Line Chart: Number of LCPs vs N-labels with Inference Time Comparison
### Overview
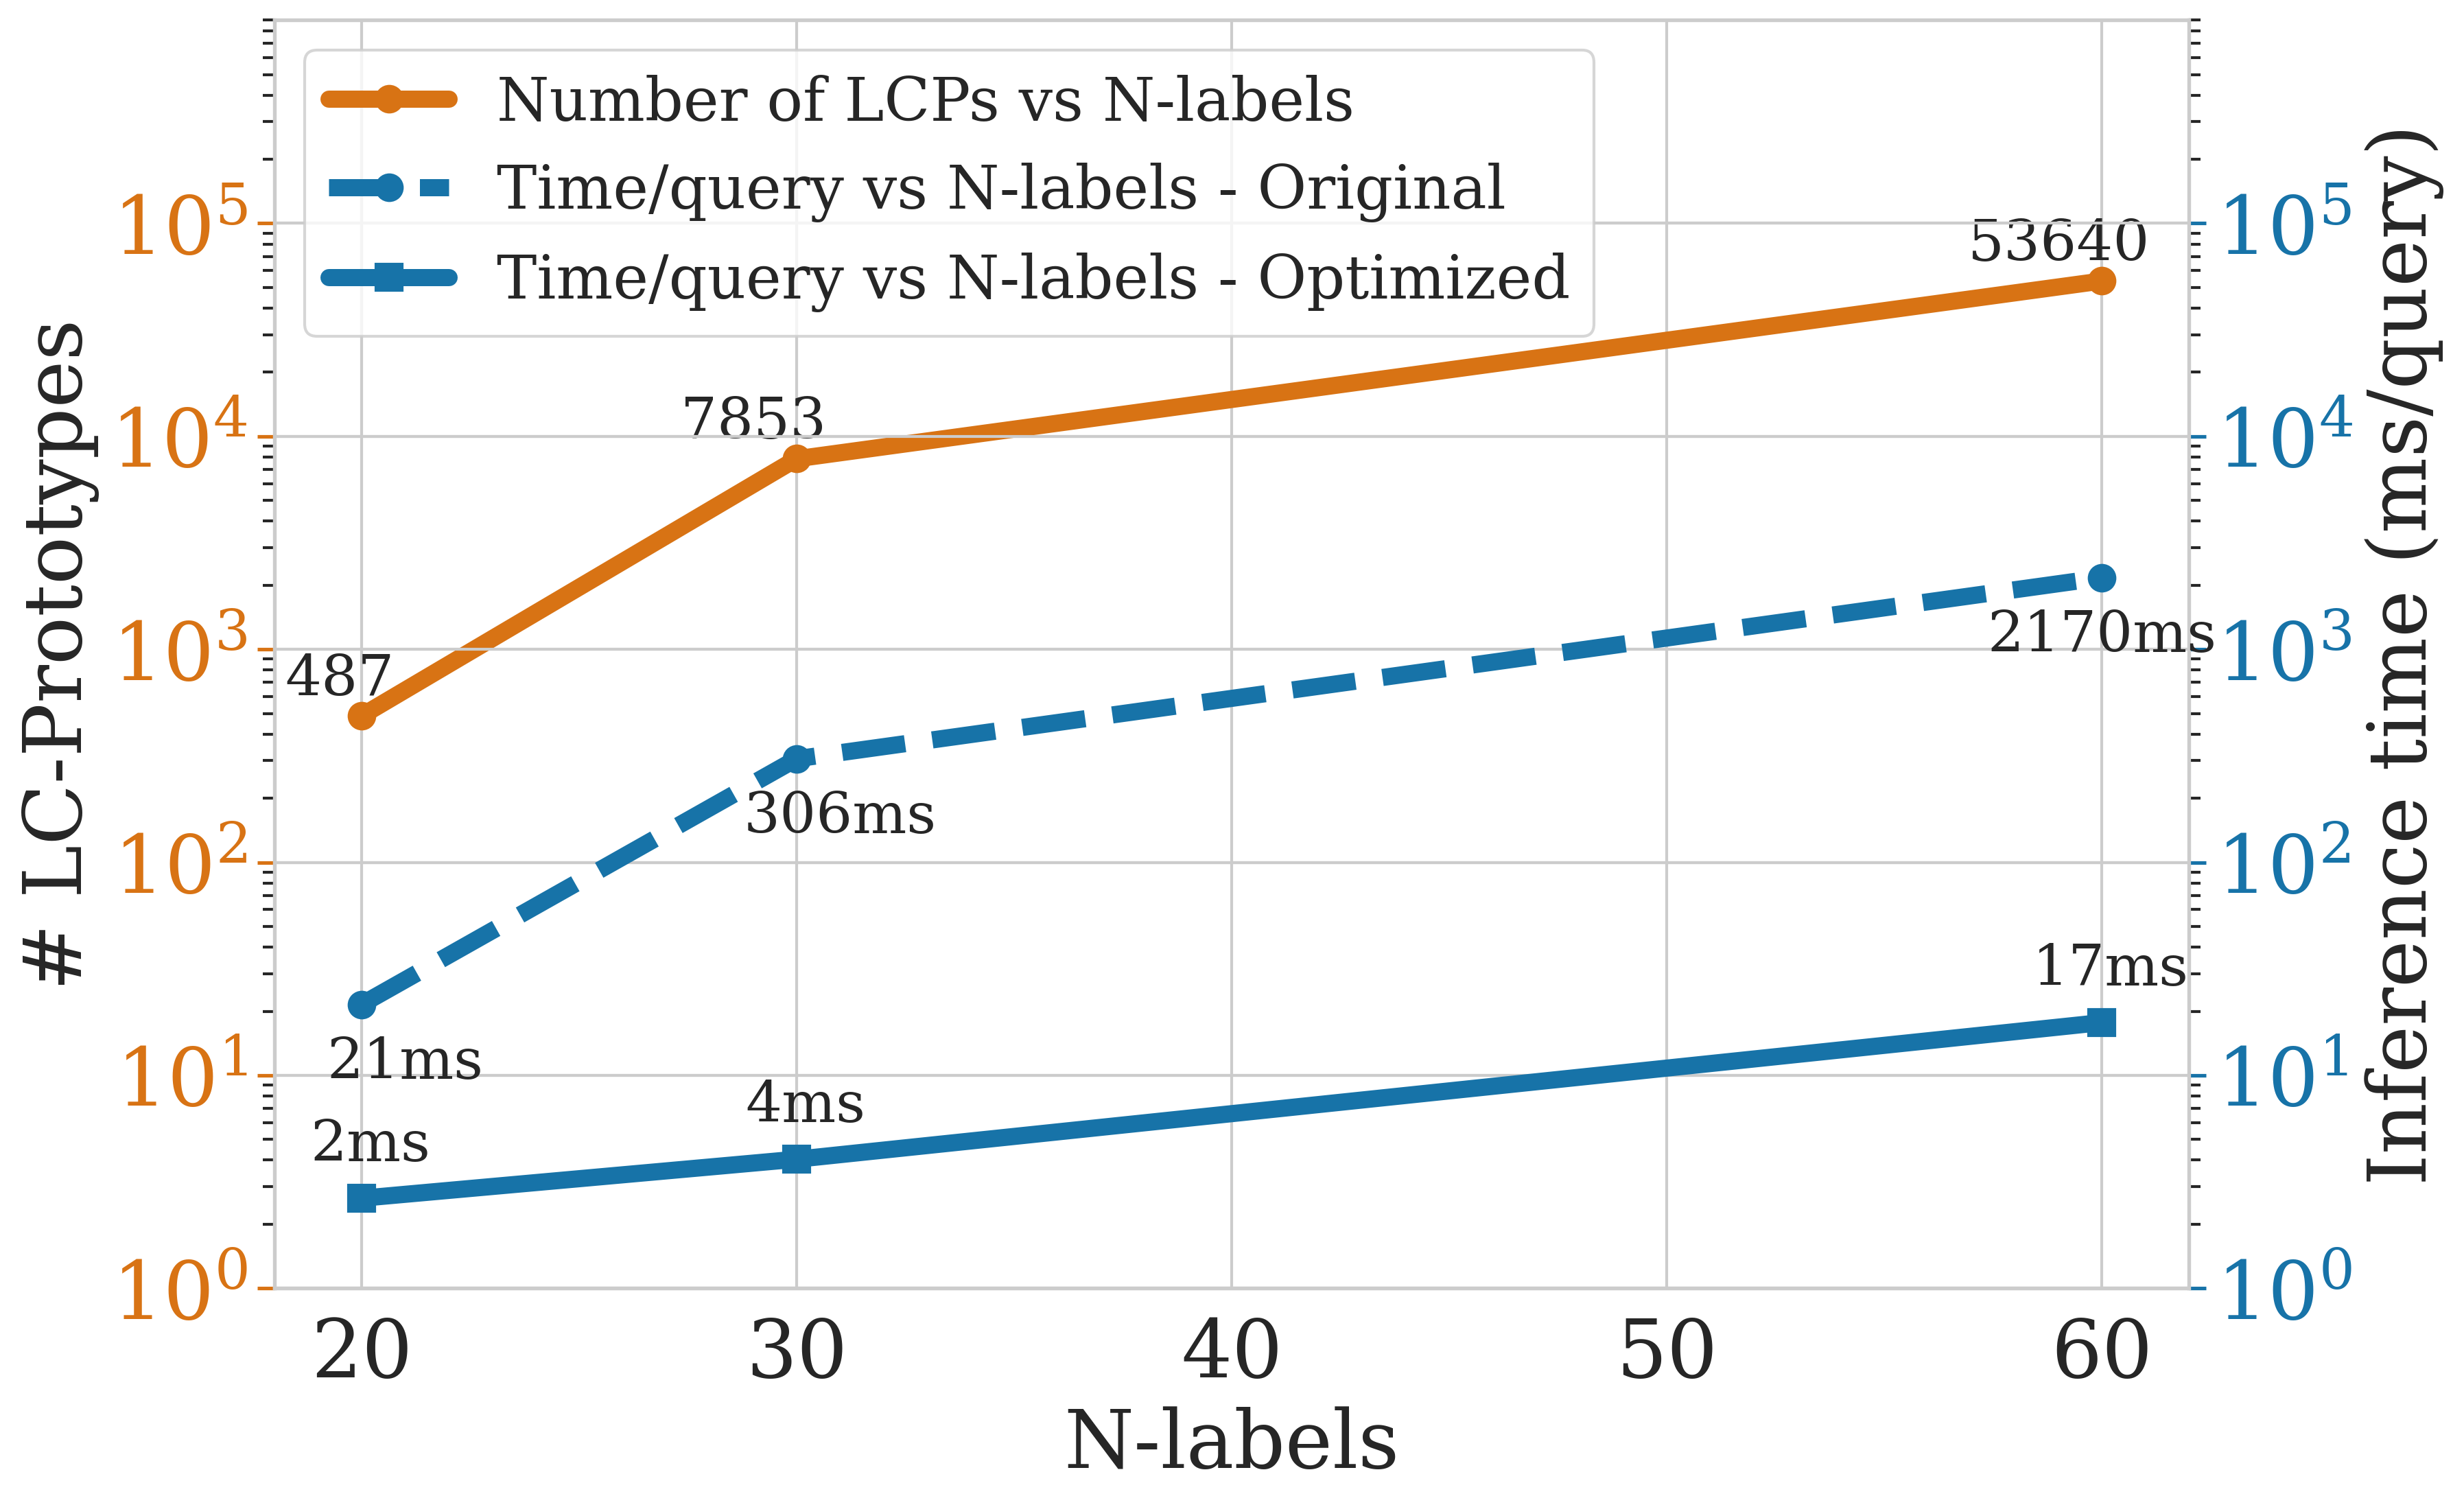
The chart compares three metrics across N-labels (20-60):
1. Number of LC-Prototypes (orange line)
2. Original inference time/query (dashed blue line)
3. Optimized inference time/query (solid blue line)
All axes use logarithmic scales to emphasize exponential trends.
### Components/Axes
- **X-axis**: N-labels (20, 30, 40, 50, 60)
- **Left Y-axis**: # LC-Prototypes (log scale: 10⁰ to 10⁵)
- **Right Y-axis**: Inference time (ms/query) (log scale: 10⁰ to 10⁵)
- **Legend**:
- Orange circles: Number of LCPs
- Dashed blue: Original inference time
- Solid blue: Optimized inference time
### Detailed Analysis
1. **Number of LCPs (Orange Line)**
- 20 N-labels: 487 prototypes
- 30 N-labels: 7,853 prototypes
- 60 N-labels: 53,640 prototypes
- *Trend*: Exponential growth (doubles between 20→30, triples between 30→60)
2. **Original Inference Time (Dashed Blue Line)**
- 20 N-labels: 21ms/query
- 30 N-labels: 306ms/query
- 60 N-labels: 2,170ms/query
- *Trend*: Exponential increase (14x between 20→30, 7x between 30→60)
3. **Optimized Inference Time (Solid Blue Line)**
- 20 N-labels: 2ms/query
- 30 N-labels: 4ms/query
- 60 N-labels: 17ms/query
- *Trend*: Linear growth (2x between 20→30, 4.25x between 30→60)
### Key Observations
- LC-Prototype count grows **exponentially** with N-labels (16x increase from 20→60)
- Original inference time grows **exponentially** (100x increase from 20→60)
- Optimized inference time grows **linearly** (8.5x increase from 20→60)
- At 60 N-labels, optimized time is **128x faster** than original (2,170ms vs 17ms)
### Interpretation
The chart demonstrates a critical tradeoff:
1. **LC-Prototype Explosion**: The number of prototypes grows exponentially with N-labels, suggesting combinatorial complexity in label combinations.
2. **Optimization Impact**: The optimized inference time shows near-linear scaling despite increasing N-labels, indicating algorithmic improvements (e.g., caching, parallelization, or model distillation).
3. **Practical Implications**:
- At 60 N-labels, original systems would take ~2 seconds per query vs optimized 17ms – a 128x speedup.
- The log scales reveal that raw LC-Prototype counts (10⁴-10⁵ range) are impractical for real-time systems without optimization.
- The optimized line's near-linear trend suggests the system avoids combinatorial explosion through smart resource allocation or approximation techniques.
*Note: All values are extracted from labeled data points; intermediate values (e.g., 40 N-labels) are interpolated from the logarithmic trend.*