## Grid Diagram: Coordinate System with Symbolic Markers
### Overview
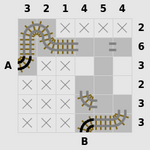
The image depicts a 2-row (A, B) by 5-column grid with numerical and symbolic annotations. The grid contains "X" markers, checkered patterns, and numerical labels on the top and left axes. The layout suggests a coordinate system or mapping of specific positions, possibly for tracking or categorization.
### Components/Axes
- **Row Labels**:
- **A** (top row)
- **B** (bottom row)
- **Column Labels**:
- **1, 2, 3, 4, 5** (horizontal axis, top of the grid)
- **Axis Numbers**:
- **Top Axis (Columns)**: 3, 2, 1, 4, 5, 4 (left to right)
- **Left Axis (Rows)**: 2, 6, 3, 2, 3, 3 (top to bottom)
- **Symbols**:
- **"X"**: Appears in specific cells (e.g., A1, A2, A3, A4, A5, B1, B2, B3, B4, B5).
- **Checkered Pattern**: Appears in cells A1, A2, A3, A4, A5, B1, B2, B3, B4, B5.
- **Curved Lines**: Two curved lines (black with yellow borders) in A1 and B5, possibly indicating movement or connections.
### Detailed Analysis
- **Row A**:
- Columns 1–5: All cells contain "X" and checkered patterns.
- Top axis numbers: 3 (column 1), 2 (column 2), 1 (column 3), 4 (column 4), 5 (column 5), 4 (column 6, but only 5 columns exist).
- **Row B**:
- Columns 1–5: All cells contain "X" and checkered patterns.
- Left axis numbers: 2 (row A), 6 (row B), 3 (row A), 2 (row B), 3 (row A), 3 (row B).
- **Curved Lines**:
- **A1**: A black curved line with a yellow border, starting from the top-left corner and curving downward.
- **B5**: A similar curved line starting from the bottom-right corner and curving upward.
### Key Observations
1. **Symmetry**: The grid is symmetric in terms of "X" and checkered patterns, with all cells in rows A and B containing these markers.
2. **Axis Numbers**: The top and left axis numbers do not align with the grid's column/row count (e.g., 6 numbers on the left for 2 rows). This suggests a non-standard labeling system or potential error.
3. **Curved Lines**: The lines in A1 and B5 may indicate directional flow or connections between specific cells.
### Interpretation
- **Purpose**: The grid likely represents a mapping system, such as a maze, a tracking grid, or a symbolic representation of data points. The "X" markers could denote obstacles, targets, or data entries, while the checkered patterns might signify specific zones or categories.
- **Axis Labels**: The numerical labels on the axes (e.g., 3, 2, 1, 4, 5, 4 on the top; 2, 6, 3, 2, 3, 3 on the left) are ambiguous. They may represent coordinates, weights, or other metrics, but their relationship to the grid's structure is unclear.
- **Curved Lines**: The lines in A1 and B5 could symbolize movement paths, dependencies, or transitions between cells. Their placement at the grid's corners suggests they might connect to external systems or boundaries.
### Notable Anomalies
- **Mismatched Axis Labels**: The top axis has 6 numbers for 5 columns, and the left axis has 6 numbers for 2 rows. This inconsistency may indicate a formatting error or a non-standard coordinate system.
- **Redundant Markers**: All cells contain both "X" and checkered patterns, which could imply overlapping categories or a lack of distinction between data types.
### Conclusion
The diagram appears to be a symbolic or abstract representation of a grid-based system. While the exact purpose is unclear, the presence of "X" markers, checkered patterns, and curved lines suggests it could be used for navigation, data categorization, or process mapping. Further context is needed to interpret the axis labels and numerical values definitively.