## Sunburst Diagram: Mathematics Curriculum Knowledge Map
### Overview
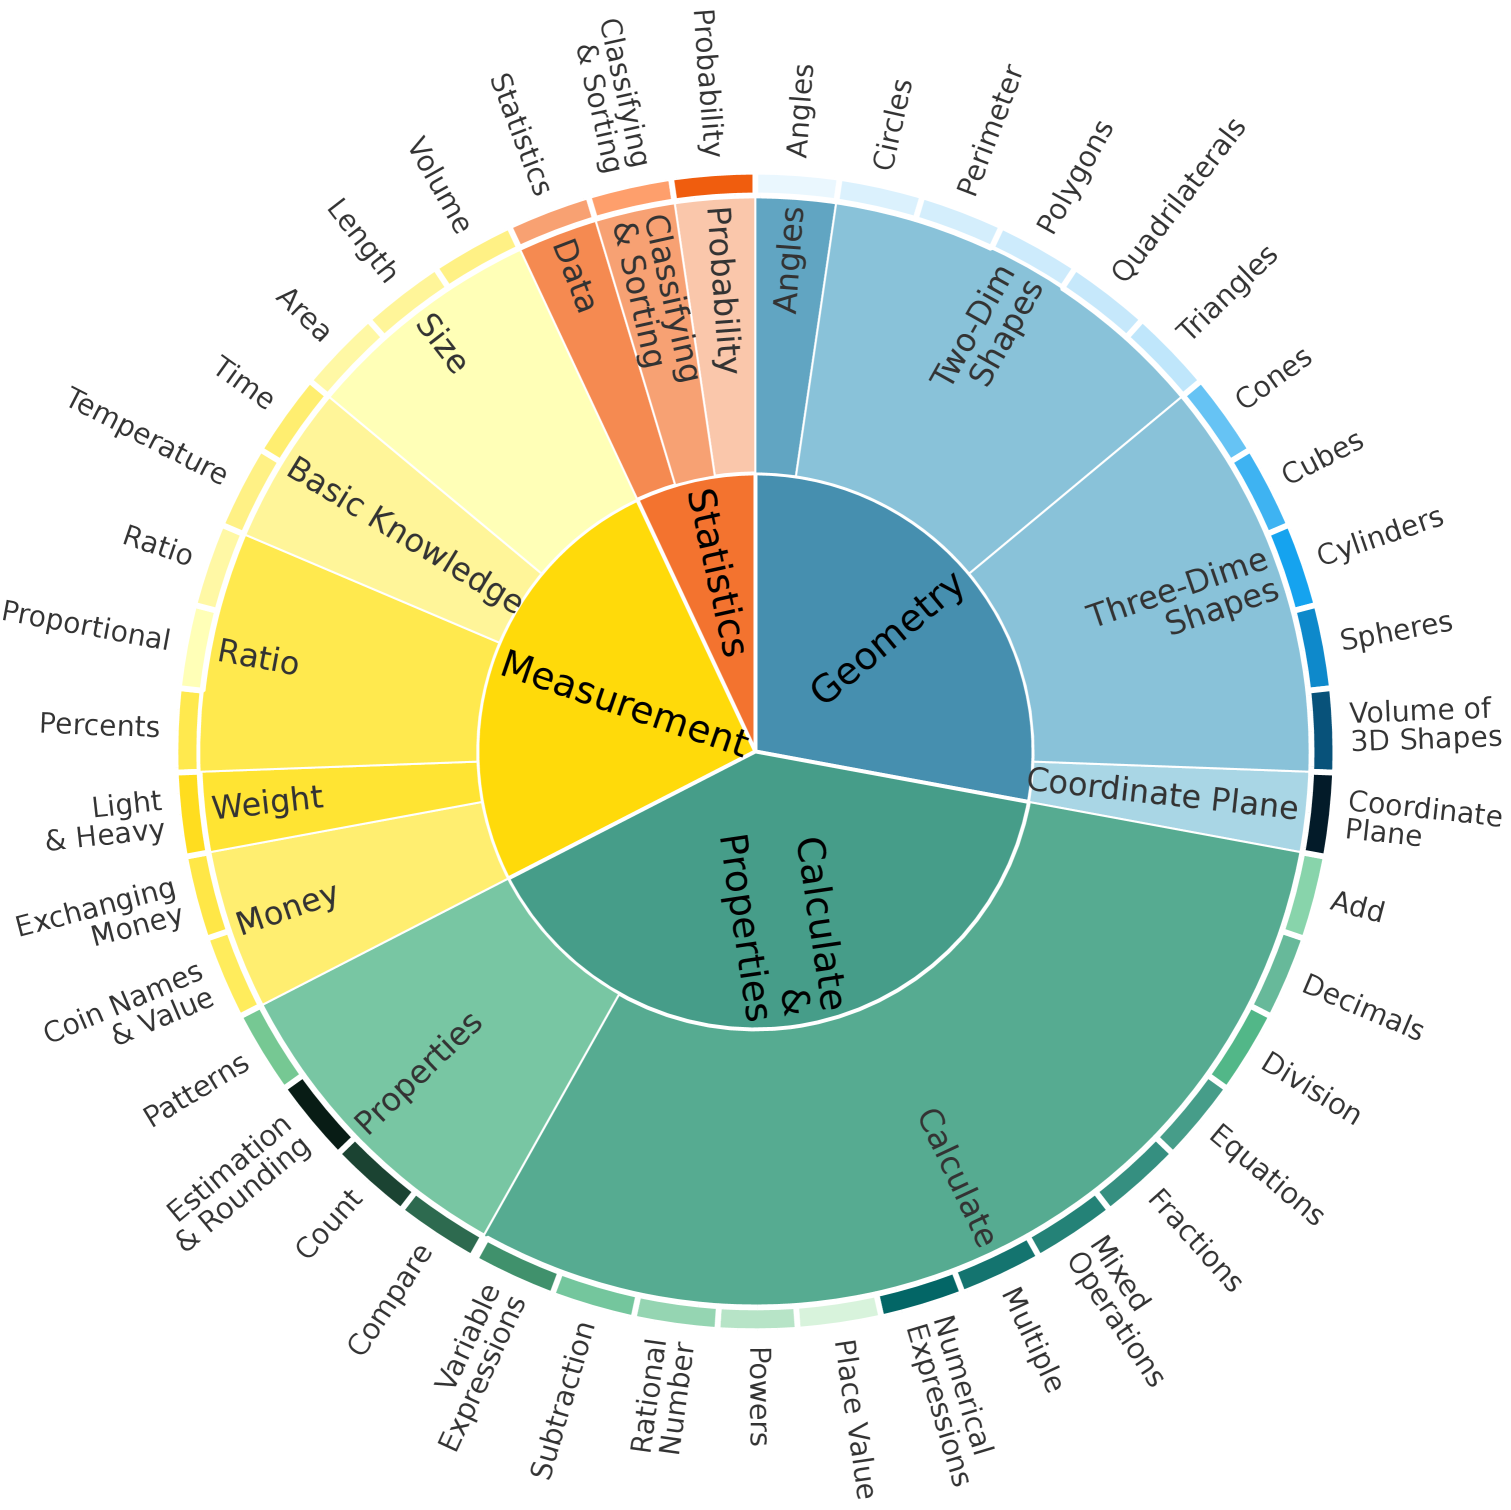
The image displays a multi-level circular sunburst chart (also known as a radial treemap or multi-level pie chart) that visually organizes mathematical topics into a hierarchical structure. It represents a taxonomy or curriculum map, likely for K-12 mathematics education, showing how broad domains break down into specific sub-topics. The diagram uses color-coding and radial segmentation to illustrate relationships and relative emphasis.
### Components/Axes
The diagram has three concentric rings or levels, radiating from the center outward:
1. **Inner Circle (Core Domains):** Four primary mathematical domains, each assigned a distinct color.
2. **Middle Ring (Sub-Domains):** Major sub-categories within each core domain.
3. **Outer Ring (Specific Topics):** Granular topics or skills within each sub-domain.
**Color Legend (by Core Domain):**
* **Yellow:** Measurement
* **Orange:** Statistics
* **Blue:** Geometry
* **Green:** Calculate & Properties
**Spatial Layout:**
* The **Measurement** domain (yellow) occupies the bottom-left quadrant.
* The **Statistics** domain (orange) occupies the top-left quadrant.
* The **Geometry** domain (blue) occupies the top-right quadrant.
* The **Calculate & Properties** domain (green) occupies the bottom-right quadrant.
### Detailed Analysis
#### 1. Core Domain: Measurement (Yellow)
* **Sub-Domains (Middle Ring):**
* Basic Knowledge
* Ratio
* Weight
* Money
* **Specific Topics (Outer Ring, clockwise from top):**
* *Under Basic Knowledge:* Size, Length, Area, Volume, Time, Temperature.
* *Under Ratio:* Ratio, Proportional, Percents.
* *Under Weight:* Light & Heavy.
* *Under Money:* Exchanging Money, Coin Names & Value.
#### 2. Core Domain: Statistics (Orange)
* **Sub-Domains (Middle Ring):**
* Data
* Classifying & Sorting
* Probability
* **Specific Topics (Outer Ring, clockwise from top):**
* *Under Data:* Statistics.
* *Under Classifying & Sorting:* Classifying & Sorting.
* *Under Probability:* Probability.
#### 3. Core Domain: Geometry (Blue)
* **Sub-Domains (Middle Ring):**
* Angles
* Two-Dim Shapes
* Three-Dim Shapes
* Coordinate Plane
* **Specific Topics (Outer Ring, clockwise from top):**
* *Under Angles:* Angles.
* *Under Two-Dim Shapes:* Circles, Perimeter, Polygons, Quadrilaterals, Triangles.
* *Under Three-Dim Shapes:* Cones, Cubes, Cylinders, Spheres, Volume of 3D Shapes.
* *Under Coordinate Plane:* Coordinate Plane.
#### 4. Core Domain: Calculate & Properties (Green)
* **Sub-Domains (Middle Ring):**
* Properties
* Calculate
* **Specific Topics (Outer Ring, clockwise from bottom-left):**
* *Under Properties:* Patterns, Estimation & Rounding, Count, Compare, Variable Expressions.
* *Under Calculate:* Subtraction, Rational Number, Powers, Place Value, Numerical Expressions, Multiple, Mixed Operations, Fractions, Equations, Division, Decimals, Add.
### Key Observations
* **Hierarchical Emphasis:** The width of each segment appears to represent relative emphasis or curricular weight. For example, within "Geometry," the "Two-Dim Shapes" segment is significantly wider than "Angles," suggesting it covers more topics or is a larger unit of study.
* **Topic Density:** The "Calculate & Properties" domain has the highest density of specific topics in the outer ring, indicating it encompasses a wide range of fundamental arithmetic and algebraic skills.
* **Color Consistency:** Each sub-domain and its child topics in the outer ring consistently share the same base color as their parent core domain, with slight variations in shade for visual distinction.
* **Radial Flow:** The diagram is organized to be read clockwise within each quadrant, moving from broader concepts near the center to specific skills at the periphery.
### Interpretation
This diagram serves as a **visual curriculum framework or knowledge map for mathematics**. It demonstrates a structured, hierarchical approach to organizing mathematical concepts, moving from foundational domains to discrete, teachable skills.
* **Relationships:** It explicitly shows dependency and categorization. For instance, understanding "Volume of 3D Shapes" is nested under the broader "Three-Dim Shapes" sub-domain, which itself is part of the core "Geometry" domain. This helps educators and learners see how specific skills fit into the larger picture.
* **Pedagogical Insight:** The segmentation suggests a potential learning pathway or unit structure. A teacher might design a unit on "Geometry" that first covers "Angles," then progresses through various "Two-Dim Shapes," before moving to "Three-Dim Shapes."
* **Notable Anomaly:** The "Coordinate Plane" appears both as a sub-domain in the middle ring and as a specific topic in the outer ring directly beneath it. This could indicate it is both a major sub-category and a singular, important skill within itself.
* **Overall Purpose:** The map is a tool for curriculum planning, standards alignment, or student orientation. It answers the question, "What are the components of elementary/middle school mathematics?" by providing a single, comprehensive, and visually organized reference. It emphasizes the interconnectedness of mathematical ideas while clearly delineating discrete areas of study.