## Circular Diagram: Mathematical Concept Hierarchy
### Overview
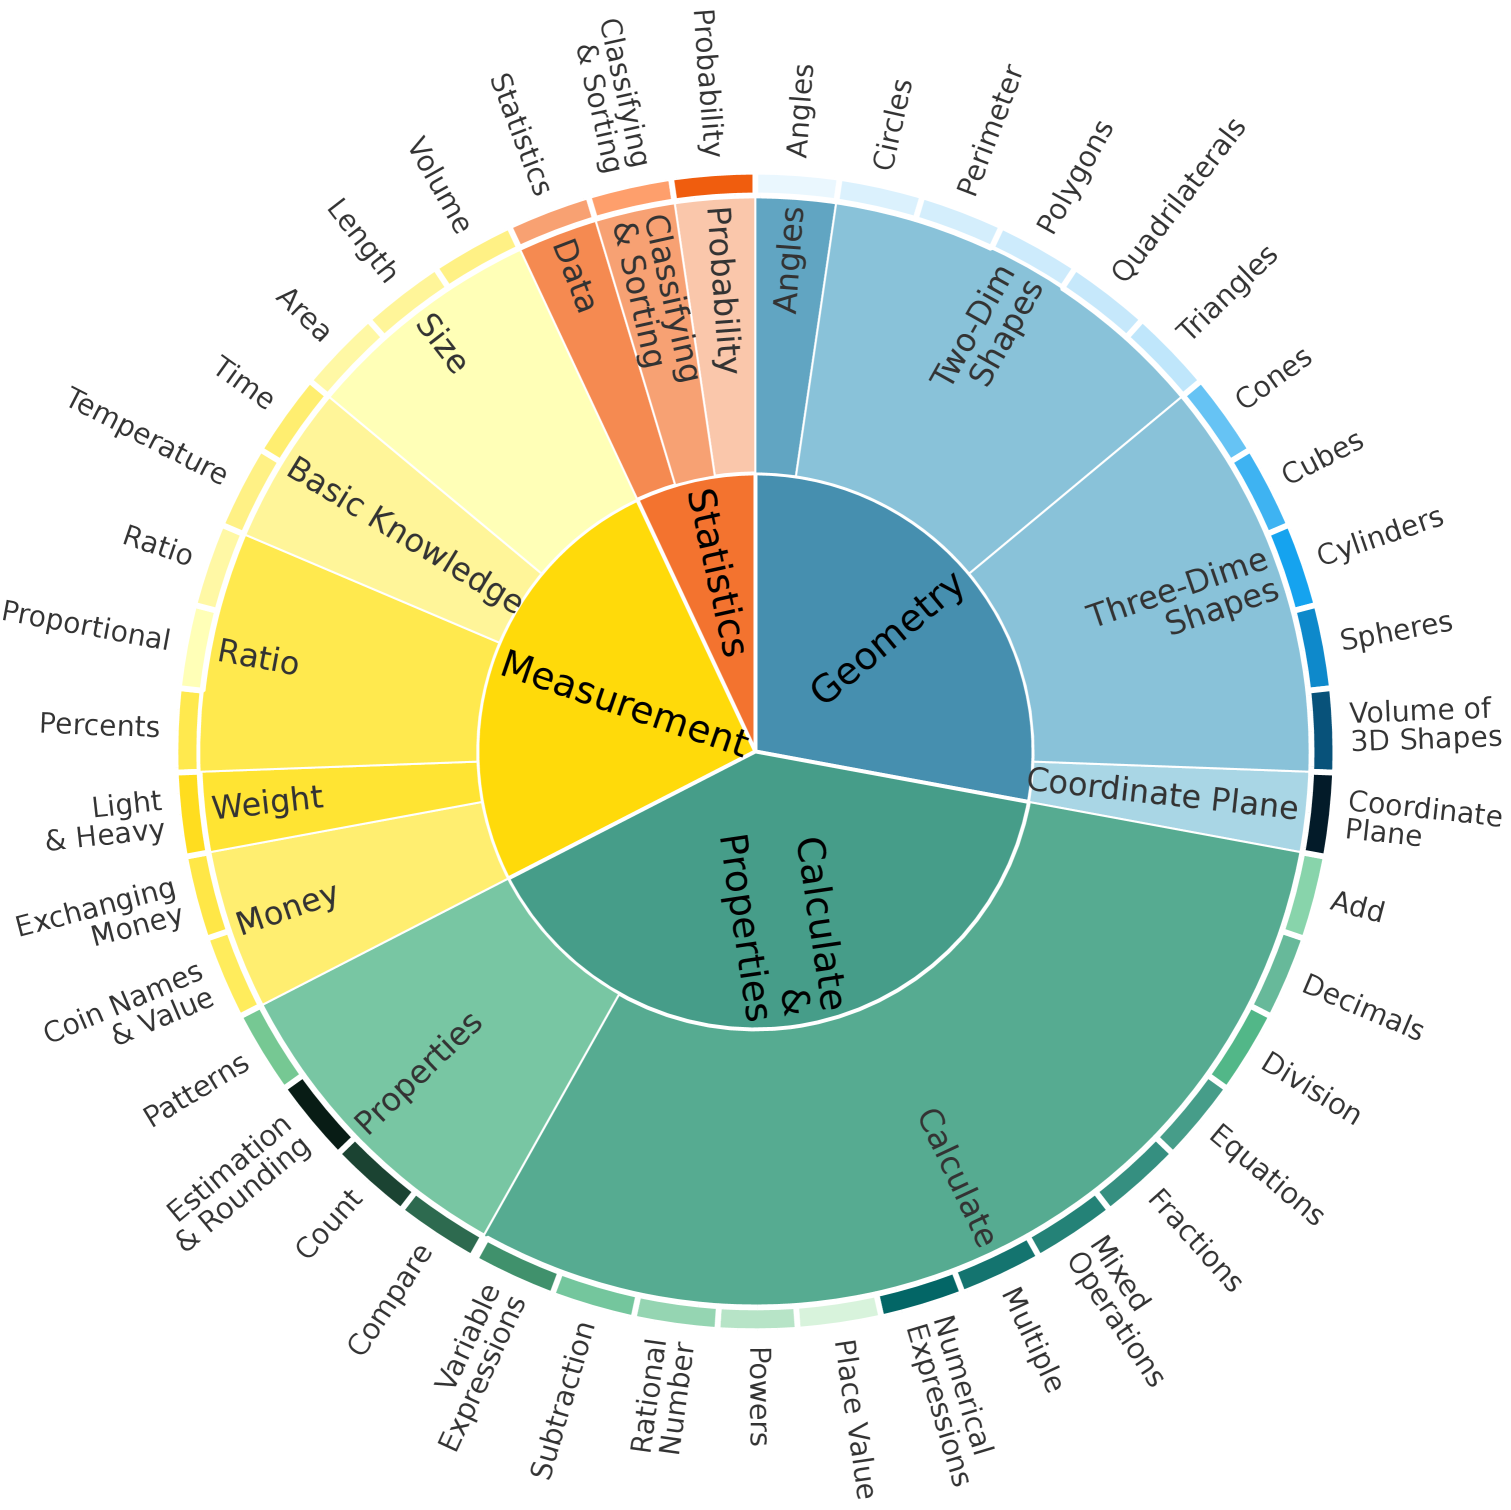
The image depicts a circular hierarchical diagram organizing mathematical concepts into three primary categories: **Geometry**, **Measurement**, and **Calculate & Properties**. Each category branches into subcategories with color-coded segments. The diagram uses concentric rings to represent hierarchical relationships, with the outermost ring showing broad categories and inner rings detailing subcategories.
### Components/Axes
- **Main Categories** (outermost ring):
- Geometry (blue)
- Measurement (yellow)
- Calculate & Properties (green)
- **Subcategories** (middle ring):
- Geometry: Two-Dim Shapes, Three-Dim Shapes, Coordinate Plane
- Measurement: Basic Knowledge, Statistics, Size
- Calculate & Properties: Calculate, Properties
- **Sub-subcategories** (innermost ring):
- Geometry: Triangles, Quadrilaterals, Polygons, etc.
- Measurement: Ratio, Proportional, Data, Probability, etc.
- Calculate: Add, Subtract, Multiply, etc.
- Properties: Count, Compare, Estimation, etc.
- **Legend**: Located at the top, with color coding:
- Yellow = Measurement
- Blue = Geometry
- Green = Calculate & Properties
### Detailed Analysis
1. **Geometry** (blue):
- Two-Dim Shapes: Triangles, Quadrilaterals, Polygons, Perimeter, Angles
- Three-Dim Shapes: Cubes, Cylinders, Spheres, Cones, Volume of 3D Shapes
- Coordinate Plane: Coordinate Plane (subcategory)
2. **Measurement** (yellow):
- Basic Knowledge: Ratio, Proportional, Percent, Temperature, Time
- Statistics: Data, Classifying & Sorting, Probability
- Size: Length, Area, Volume
3. **Calculate & Properties** (green):
- Calculate: Add, Subtract, Multiply, Divide, Fractions, Decimals, etc.
- Properties: Count, Compare, Estimation & Rounding, Patterns, Variables, etc.
### Key Observations
- **Hierarchical Structure**: Concepts are organized from broad categories (Geometry) to specific subcategories (e.g., "Triangles" under Two-Dim Shapes).
- **Color Coding**: Main categories use distinct colors (yellow, blue, green), while subcategories use lighter shades of the same color.
- **Size Proportions**:
- Calculate & Properties occupies ~40% of the diagram (largest section).
- Geometry (~35%) and Measurement (~25%) are smaller.
- **Subcategory Density**:
- Geometry has the most sub-subcategories (14+).
- Measurement has moderate density (12+).
- Calculate & Properties has the highest subcategory count (20+).
### Interpretation
This diagram visually represents the interconnectedness of mathematical concepts, emphasizing:
1. **Foundational Role of Calculation**: The largest section (Calculate & Properties) suggests arithmetic operations and numerical properties form the base of mathematical understanding.
2. **Spatial vs. Abstract Concepts**: Geometry (spatial) and Measurement (practical applications) are positioned as complementary to calculation.
3. **Hierarchical Learning Path**: The concentric rings imply a progression from broad topics (Geometry) to specific skills (e.g., "Volume of 3D Shapes").
4. **Interdisciplinary Links**: Overlapping subcategories (e.g., "Ratio" appears in both Basic Knowledge and Properties) highlight cross-topic applications.
The diagram serves as a pedagogical tool to illustrate how mathematical domains interrelate, with Calculate & Properties acting as a central hub connecting spatial, measurement, and abstract concepts.