# Technical Document Extraction: Turn Accuracy vs. Task Length
## 1. Component Isolation
* **Header:** None present.
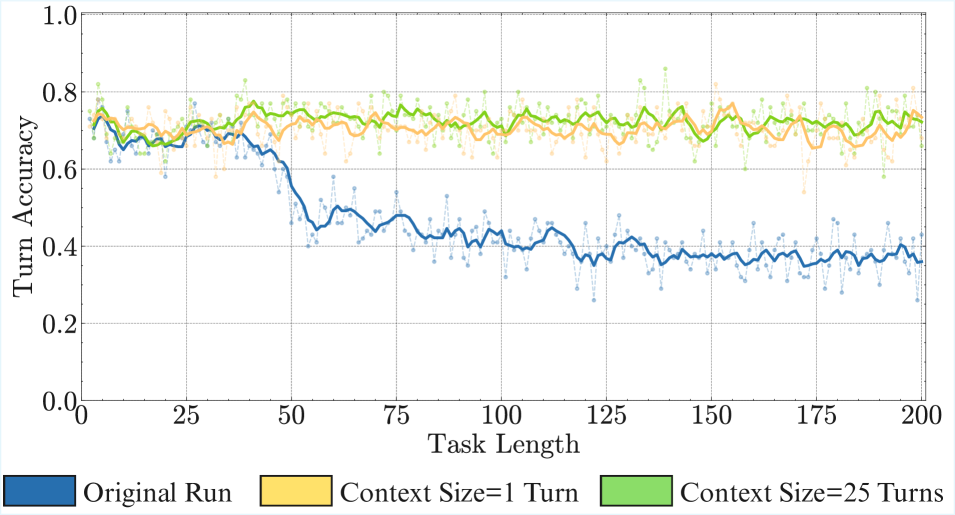
* **Main Chart Area:** A line graph plotted on a Cartesian coordinate system with a grid. It features three distinct data series, each represented by a solid trend line (moving average) and a faint, dashed line with individual data points.
* **Footer (Legend):** Located at the bottom of the image, centered horizontally.
---
## 2. Axis and Label Extraction
* **Y-Axis Label:** "Turn Accuracy" (Vertical, left-aligned).
* **Y-Axis Scale:** Ranges from `0.0` to `1.0` with major tick marks and labels every `0.2` units. Minor tick marks are present at `0.1` intervals.
* **X-Axis Label:** "Task Length" (Horizontal, bottom-centered).
* **X-Axis Scale:** Ranges from approximately `0` to `200`. Major tick marks and labels are placed at `25, 50, 75, 100, 125, 150, 175, 200`.
---
## 3. Legend and Data Series Identification
The legend is located at the bottom of the chart.
| Color | Label | Visual Trend Description |
| :--- | :--- | :--- |
| **Blue** | `Original Run` | Starts high (~0.75), remains stable until Task Length 50, then drops sharply to ~0.4 and fluctuates around that level for the remainder of the task. |
| **Yellow/Gold** | `Context Size=1 Turn` | Starts at ~0.75, shows high variance but maintains a relatively flat horizontal trend between 0.65 and 0.75 throughout the entire task length. |
| **Green** | `Context Size=25 Turns` | Starts at ~0.75, maintains a stable horizontal trend with moderate variance, generally staying between 0.7 and 0.8 throughout the task length. |
---
## 4. Detailed Data Analysis and Key Trends
### Series 1: Original Run (Blue)
* **Initial Phase (0-50):** Accuracy begins at approximately 0.75. It fluctuates slightly but maintains a mean above 0.65.
* **Degradation Phase (50-60):** A significant and rapid decline occurs. Accuracy drops from ~0.6 to ~0.45 within 10 units of Task Length.
* **Stable Low Phase (60-200):** The accuracy plateaus. While there is significant "noise" (individual points ranging from 0.25 to 0.55), the smoothed trend line remains consistently near the 0.4 mark.
### Series 2: Context Size=1 Turn (Yellow/Gold)
* **Overall Trend:** This series exhibits the highest degree of point-to-point volatility (noise).
* **Performance:** Despite the noise, the performance does not decay over time. It maintains an average accuracy of approximately 0.70 across the entire x-axis.
* **Comparison:** It significantly outperforms the "Original Run" after Task Length 50.
### Series 3: Context Size=25 Turns (Green)
* **Overall Trend:** This is the highest-performing series. It shows a very slight upward trend or stabilization after the initial 50 turns.
* **Performance:** The trend line stays consistently between 0.7 and 0.8. It appears more stable (less variance in the dashed line) than the "Context Size=1 Turn" series.
* **Comparison:** This configuration provides the most reliable and highest accuracy for long-duration tasks.
---
## 5. Summary of Findings
The chart demonstrates a "long-context" or "long-task" performance issue in the **Original Run**, where accuracy collapses after 50 turns. Implementing a fixed context window (either 1 turn or 25 turns) effectively mitigates this collapse, maintaining accuracy levels above 0.7 for the duration of a 200-turn task. The **Context Size=25 Turns** (Green) provides the most stable and highest overall accuracy.