## Line Chart: On-Policy GRPO with zero variance masking ($\pi_k$)
### Overview
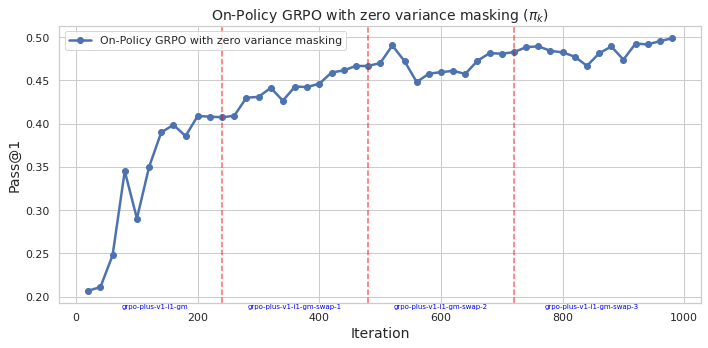
This image displays a line chart tracking the performance of an "On-Policy GRPO (Group Relative Policy Optimization) with zero variance masking" model. The chart plots the "Pass@1" metric (a common evaluation metric for code generation or reasoning tasks) against training "Iteration" counts from 0 to 1000. The data shows a consistent upward trend in performance, segmented into four distinct phases corresponding to specific model versions.
### Components/Axes
* **Y-Axis:** Labeled "Pass@1", representing the performance metric. The scale ranges from 0.20 to 0.50 in increments of 0.05.
* **X-Axis:** Labeled "Iteration", representing the training progress. The scale ranges from 0 to 1000 in increments of 200.
* **Legend:** Located in the top-left corner, identifying the data series as "On-Policy GRPO with zero variance masking" (represented by a blue line with circular markers).
* **Vertical Markers:** Three dashed red vertical lines are positioned at approximately iterations 240, 500, and 720, acting as delimiters for different training phases.
* **Phase Labels:** Located along the bottom of the chart, between the vertical markers:
* **0–240:** `grpo-plus-v1-l1-gm`
* **240–500:** `grpo-plus-v1-l1-gm-swap-1`
* **500–720:** `grpo-plus-v1-l1-gm-swap-2`
* **720–1000:** `grpo-plus-v1-l1-gm-swap-3`
### Detailed Analysis
The data series follows a generally upward trajectory, indicating successful model learning.
* **Trend Verification:**
* **Initial Phase (0–240):** The curve starts at ~0.21. It rises sharply to ~0.35, experiences a significant drop to ~0.29 at iteration ~100, then recovers and climbs steadily to ~0.41 by iteration 240.
* **Second Phase (240–500):** The curve continues to rise, albeit with a slightly shallower slope than the initial phase, reaching ~0.47 by iteration 500.
* **Third Phase (500–720):** The curve shows a slight dip at ~550 (dropping to ~0.45) before recovering and climbing to ~0.485 by iteration 720.
* **Final Phase (720–1000):** The curve exhibits a plateauing effect, oscillating slightly but trending upward to reach a peak of ~0.50 at iteration 980.
* **Data Point Summary (Approximate):**
| Event | Iteration | Pass@1 |
| :--- | :--- | :--- |
| Start | ~30 | ~0.21 |
| Local Minimum | ~100 | ~0.29 |
| Phase 1 End | ~240 | ~0.41 |
| Phase 2 End | ~500 | ~0.47 |
| Phase 3 End | ~720 | ~0.485 |
| End | ~980 | ~0.50 |
### Key Observations
* **Learning Stability:** Despite the initial volatility (the dip at iteration 100), the model demonstrates robust learning, consistently recovering from minor performance drops.
* **Diminishing Returns:** The rate of improvement (slope) decreases as the iteration count increases. The jump from 0.20 to 0.40 happens much faster than the jump from 0.40 to 0.50.
* **Segmentation:** The vertical markers and "swap" labels suggest that the training process involves distinct stages, likely representing curriculum learning, model checkpoint swapping, or hyperparameter adjustments at specific intervals.
### Interpretation
The data demonstrates that the "On-Policy GRPO with zero variance masking" approach is effective at improving model performance over time. The "swap" nomenclature suggests an iterative training strategy where the model is likely being fine-tuned or updated with different data subsets or configurations (e.g., `swap-1`, `swap-2`, `swap-3`).
The significant dip at iteration 100 is a notable anomaly, possibly indicating a point of instability or a transition in the training data distribution. However, the subsequent recovery and sustained growth suggest that the "zero variance masking" technique successfully mitigates the risks of divergence, allowing the model to converge toward a 50% Pass@1 rate. The plateauing behavior toward the end of the 1000 iterations suggests the model is approaching the limits of its current configuration or data, indicating that further gains might require a change in strategy or additional data.