## Line Chart: On-Policy GRPO with zero variance masking (πk)
### Overview
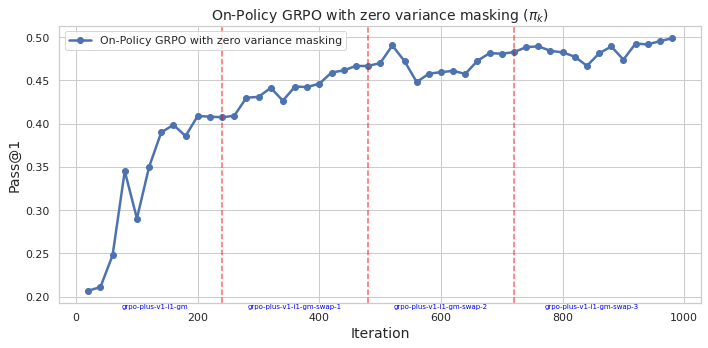
The image is a line chart showing the performance of "On-Policy GRPO with zero variance masking" over 1000 iterations. The y-axis represents "Pass@1", a performance metric, and the x-axis represents "Iteration". The chart includes a single data series and three vertical dashed lines indicating different stages or configurations.
### Components/Axes
* **Title:** On-Policy GRPO with zero variance masking (πk)
* **X-axis:**
* Label: Iteration
* Scale: 0 to 1000, with major ticks at 0, 200, 400, 600, 800, and 1000.
* Sub-categories: "grpo-plus-v1-l1-gm", "grpo-plus-v1-l1-gm-swap-1", "grpo-plus-v1-l1-gm-swap-2", "grpo-plus-v1-l1-gm-swap-3" positioned approximately at iterations 100, 400, 650, and 900 respectively.
* **Y-axis:**
* Label: Pass@1
* Scale: 0.20 to 0.50, with major ticks at intervals of 0.05.
* **Legend:** Located in the top-left corner.
* Label: "On-Policy GRPO with zero variance masking" (represented by a blue line with circular markers).
* **Vertical Dashed Lines:** Three vertical dashed lines in a light red color are present at approximately iterations 250, 650, and 800.
### Detailed Analysis
* **Data Series:** "On-Policy GRPO with zero variance masking" (blue line with circular markers).
* **Trend:** The line generally slopes upward, indicating increasing performance with iterations. It exhibits rapid initial growth, followed by a period of stabilization and smaller fluctuations.
* **Data Points:**
* Iteration 0: Pass@1 ≈ 0.21
* Iteration 100: Pass@1 ≈ 0.39
* Iteration 200: Pass@1 ≈ 0.41
* Iteration 300: Pass@1 ≈ 0.43
* Iteration 400: Pass@1 ≈ 0.44
* Iteration 500: Pass@1 ≈ 0.47
* Iteration 600: Pass@1 ≈ 0.45
* Iteration 700: Pass@1 ≈ 0.47
* Iteration 800: Pass@1 ≈ 0.49
* Iteration 900: Pass@1 ≈ 0.47
* Iteration 1000: Pass@1 ≈ 0.50
### Key Observations
* The performance of the algorithm improves significantly in the first 200 iterations.
* The performance plateaus and fluctuates after approximately 500 iterations.
* The vertical dashed lines appear to mark changes in the configuration or stages of the experiment.
### Interpretation
The chart illustrates the learning curve of the "On-Policy GRPO with zero variance masking" algorithm. The initial rapid increase in "Pass@1" suggests that the algorithm quickly learns effective strategies. The subsequent plateau indicates that the algorithm reaches a point of diminishing returns, where further iterations do not significantly improve performance. The vertical lines likely denote changes in experimental setup, such as hyperparameter tuning or the introduction of new data. The labels "grpo-plus-v1-l1-gm", "grpo-plus-v1-l1-gm-swap-1", "grpo-plus-v1-l1-gm-swap-2", and "grpo-plus-v1-l1-gm-swap-3" suggest different configurations or variations of the GRPO algorithm being tested. The data suggests that the initial configuration "grpo-plus-v1-l1-gm" provides the most significant performance gains, while the subsequent "swap" configurations lead to smaller improvements or fluctuations.