## Diagram: Quantum Measurement Process with Ferromagnetic Correlation
### Overview
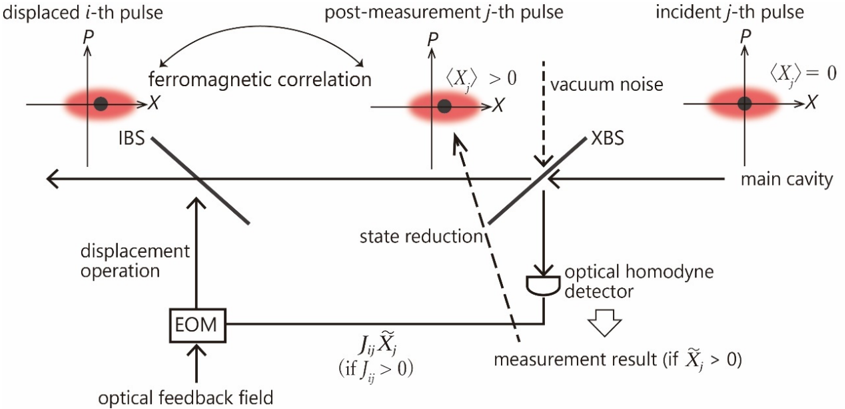
The diagram illustrates a quantum measurement process involving displaced pulses, ferromagnetic correlation, and optical feedback. It depicts the interaction of light pulses with a ferromagnetic material, state reduction, and measurement outcomes using an optical homodyne detector. Key components include an interferometric beam splitter (IBS), a traveling wave parametric amplifier (TWPA), and a main cavity.
### Components/Axes
- **Axes**:
- Horizontal axis labeled **P** (momentum) and **X** (position), representing phase space.
- Vertical axis labeled **P** (momentum) and **X** (position) for displaced pulses.
- **Labels**:
- **Displaced i-th pulse**: Red shaded region at the leftmost position.
- **Post-measurement j-th pulse**: Red shaded region with ⟨X⟩ > 0.
- **Incident j-th pulse**: Red shaded region with ⟨X⟩ = 0.
- **Ferromagnetic correlation**: Arrows connecting displaced i-th pulse to post-measurement j-th pulse.
- **Displacement operation**: Arrow from EOM to displacement operation.
- **State reduction**: Dashed arrow from post-measurement j-th pulse to optical homodyne detector.
- **Optical homodyne detector**: Symbol with downward arrow labeled "measurement result (if X̃_j > 0)".
- **EOM (Electro-Optic Modulator)**: Box labeled "EOM" with "optical feedback field" arrow.
- **IBS (Interferometric Beam Splitter)**: Labeled at the left.
- **XBS (Traveling Wave Parametric Amplifier)**: Labeled at the center.
- **Main cavity**: Labeled at the right.
### Detailed Analysis
- **Flow**:
1. **Displaced i-th pulse** (⟨X⟩ ≠ 0) enters the system, interacting with the **ferromagnetic correlation** (arrows indicate coupling).
2. The pulse propagates through the **IBS**, then the **XBS**, and into the **main cavity**.
3. The **post-measurement j-th pulse** (⟨X⟩ > 0) emerges, showing state reduction due to measurement.
4. The **incident j-th pulse** (⟨X⟩ = 0) is shown as a reference with no displacement.
5. The **EOM** generates an **optical feedback field**, which modulates the displacement operation.
6. The **optical homodyne detector** measures the final state, producing a result if X̃_j > 0.
- **Key Relationships**:
- Ferromagnetic correlation links the displaced i-th pulse to the post-measurement j-th pulse, suggesting entanglement or interaction-induced displacement.
- State reduction occurs after the j-th pulse interacts with the homodyne detector, collapsing the wavefunction.
- Vacuum noise (dashed vertical line) affects the incident j-th pulse, introducing uncertainty.
### Key Observations
- The **ferromagnetic correlation** is the central mechanism driving displacement between pulses.
- The **post-measurement j-th pulse** exhibits a non-zero expectation value ⟨X⟩ > 0, indicating successful displacement.
- The **incident j-th pulse** serves as a baseline with ⟨X⟩ = 0, highlighting the effect of measurement.
- The **optical homodyne detector** acts as the final measurement device, with results dependent on the displaced state.
### Interpretation
This diagram represents a quantum measurement protocol where ferromagnetic interactions induce displacement in light pulses. The **EOM** and **optical feedback field** enable controlled manipulation of the pulse's phase space properties. The **homodyne detector** extracts information about the displaced state, with the measurement outcome contingent on the expectation value X̃_j. The presence of vacuum noise in the incident pulse underscores the quantum uncertainty inherent in the system. The process likely models applications in quantum metrology or entanglement-based sensing, where precise control over displacement and measurement is critical.