\n
## Line Chart: L4 Norm vs. Degree
### Overview
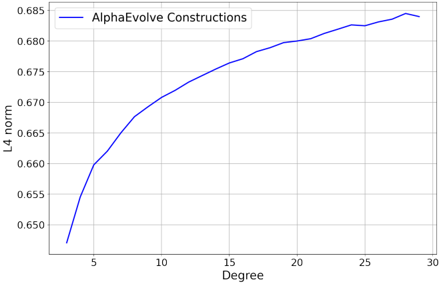
The image presents a line chart illustrating the relationship between "Degree" and "L4 norm" for "AlphaEvolve Constructions". The chart displays a single data series showing how the L4 norm changes as the degree increases.
### Components/Axes
* **X-axis:** Labeled "Degree", ranging from approximately 0 to 30. The axis has tick marks at intervals of 5.
* **Y-axis:** Labeled "L4 norm", ranging from approximately 0.655 to 0.685. The axis has tick marks at intervals of 0.005.
* **Data Series:** A single line labeled "AlphaEvolve Constructions" in the top-right corner. The line is blue.
* **Legend:** Located in the top-right corner, displaying the label "AlphaEvolve Constructions" and its corresponding blue line.
### Detailed Analysis
The blue line representing "AlphaEvolve Constructions" starts at approximately (0, 0.657) and exhibits an increasing trend.
Here's a breakdown of approximate data points:
* At Degree = 5, L4 norm ≈ 0.663
* At Degree = 10, L4 norm ≈ 0.671
* At Degree = 15, L4 norm ≈ 0.677
* At Degree = 20, L4 norm ≈ 0.681
* At Degree = 25, L4 norm ≈ 0.683
* At Degree = 30, L4 norm ≈ 0.684
The line initially shows a steep increase between Degree 0 and 10, then the rate of increase slows down between Degree 10 and 20. After Degree 20, the increase becomes very gradual, with a slight flattening around Degree 25-30.
### Key Observations
* The L4 norm consistently increases with increasing degree.
* The rate of increase is not constant; it diminishes as the degree increases.
* The curve appears to be approaching an asymptote, suggesting the L4 norm may converge to a specific value as the degree continues to increase.
### Interpretation
The chart suggests that as the "Degree" parameter increases for "AlphaEvolve Constructions", the "L4 norm" also increases, but at a decreasing rate. This could indicate a diminishing return on investment or a saturation effect. The L4 norm is a measure of the magnitude of a vector, and its increase with degree might signify growing complexity or magnitude within the "AlphaEvolve Constructions" system. The flattening of the curve at higher degrees suggests that further increases in degree yield progressively smaller changes in the L4 norm, potentially indicating a point of optimal degree beyond which further increases are less impactful. Without knowing the specific context of "AlphaEvolve Constructions" and "Degree", it's difficult to provide a more precise interpretation, but the data clearly demonstrates a non-linear relationship between these two variables.