\n
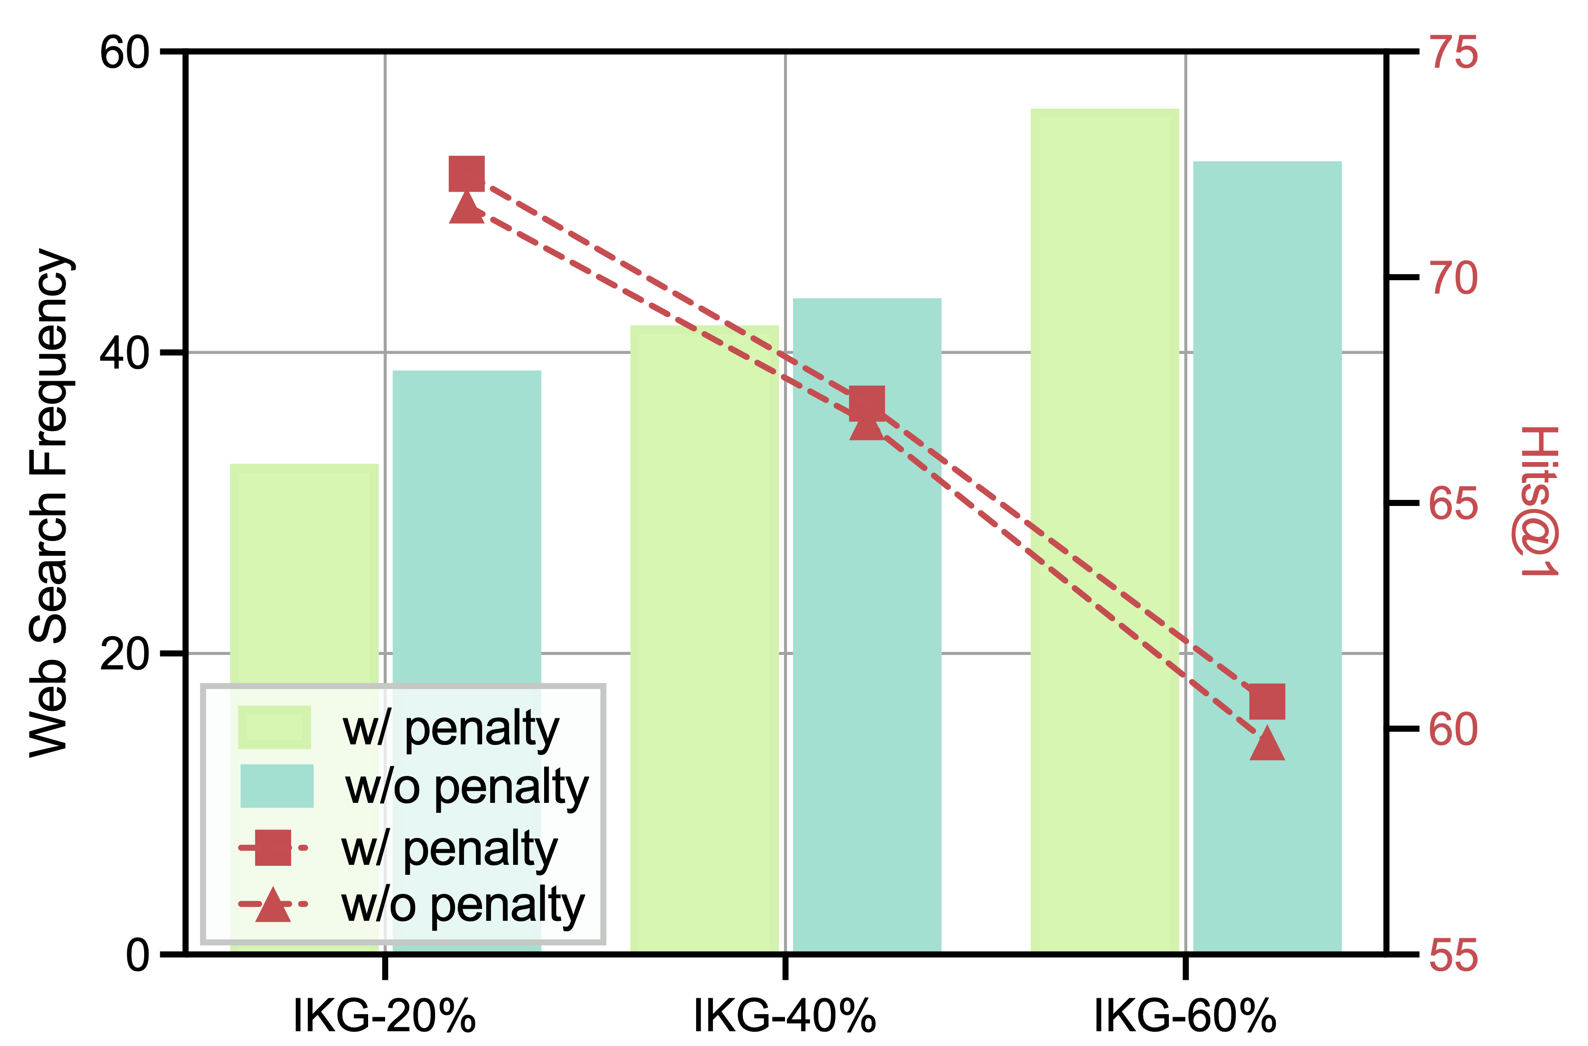
## Dual-Axis Bar and Line Chart: Web Search Frequency vs. Hits@1 Across IKG Percentages
### Overview
This image is a dual-axis combination chart displaying two metrics—**Web Search Frequency** (bar chart, left axis) and **Hits@1** (line chart, right axis)—across three categories on the x-axis: **IKG-20%**, **IKG-40%**, and **IKG-60%**. The chart compares conditions "with penalty" and "without penalty" for both metrics.
### Components/Axes
* **X-Axis (Categories):** Three discrete categories: `IKG-20%`, `IKG-40%`, `IKG-60%`.
* **Primary Y-Axis (Left):** Label: `Web Search Frequency`. Scale: 0 to 60, with major ticks at 0, 20, 40, 60.
* **Secondary Y-Axis (Right):** Label: `Hits@1`. Scale: 55 to 75, with major ticks at 55, 60, 65, 70, 75.
* **Legend (Bottom-Left):** Contains four entries:
1. Light green bar: `w/ penalty`
2. Teal bar: `w/o penalty`
3. Red square marker with dashed line: `w/ penalty`
4. Red triangle marker with dashed line: `w/o penalty`
* **Data Series:**
* **Bars (Web Search Frequency):** Two bars per x-axis category.
* **Lines (Hits@1):** Two dashed red lines with distinct markers, connecting points across the three categories.
### Detailed Analysis
**Web Search Frequency (Bars - Left Axis):**
* **IKG-20%:**
* `w/ penalty` (Light Green): ~32
* `w/o penalty` (Teal): ~39
* **IKG-40%:**
* `w/ penalty` (Light Green): ~42
* `w/o penalty` (Teal): ~44
* **IKG-60%:**
* `w/ penalty` (Light Green): ~57
* `w/o penalty` (Teal): ~53
**Hits@1 (Lines - Right Axis):**
* **Trend Verification:** Both lines show a clear downward trend from left (IKG-20%) to right (IKG-60%).
* **IKG-20%:**
* `w/ penalty` (Red Square): ~72
* `w/o penalty` (Red Triangle): ~71
* **IKG-40%:**
* `w/ penalty` (Red Square): ~67
* `w/o penalty` (Red Triangle): ~66
* **IKG-60%:**
* `w/ penalty` (Red Square): ~61
* `w/o penalty` (Red Triangle): ~60
### Key Observations
1. **Inverse Relationship:** There is a clear inverse relationship between the two metrics. As the IKG percentage increases, **Web Search Frequency increases** for both conditions, while **Hits@1 decreases** for both conditions.
2. **Penalty Effect on Frequency:** The "with penalty" condition results in lower Web Search Frequency at IKG-20% but higher frequency at IKG-60% compared to "without penalty." The crossover occurs between IKG-40% and IKG-60%.
3. **Penalty Effect on Hits@1:** The "with penalty" condition consistently yields a slightly higher Hits@1 score (by approximately 1 point) across all three IKG categories compared to "without penalty."
4. **Magnitude of Change:** The increase in Web Search Frequency from IKG-20% to IKG-60% is substantial (~25 points for "w/ penalty"). The decrease in Hits@1 over the same range is also significant (~11 points for both conditions).
### Interpretation
The data suggests a fundamental trade-off governed by the IKG parameter. Increasing the IKG percentage (which may represent a knowledge graph integration level or a similar parameter) appears to drive more frequent web searches but at the cost of reduced precision in the top result (lower Hits@1).
The "penalty" mechanism introduces a nuanced effect. It initially suppresses search frequency at lower IKG levels but amplifies it at higher levels. Crucially, it provides a consistent, albeit small, boost to result precision (Hits@1) across all settings. This implies the penalty might be a regularization term that discourages excessive or low-quality searches, thereby improving the quality of the top retrieved item even as the quantity of searches changes.
The most notable anomaly is the crossover in Web Search Frequency behavior. This indicates that the system's response to the penalty is not linear and depends heavily on the underlying IKG configuration. For practical application, if the goal is to maximize precision (Hits@1), a lower IKG percentage is better. If the goal is to maximize search frequency (perhaps for coverage or recall), a higher IKG percentage is better, and applying the penalty becomes beneficial only at these higher levels.