## Bar Chart: Accuracy and Trial Numbers across Difficulty Level (Base Model: Qwen2.5-Math-7B)
### Overview
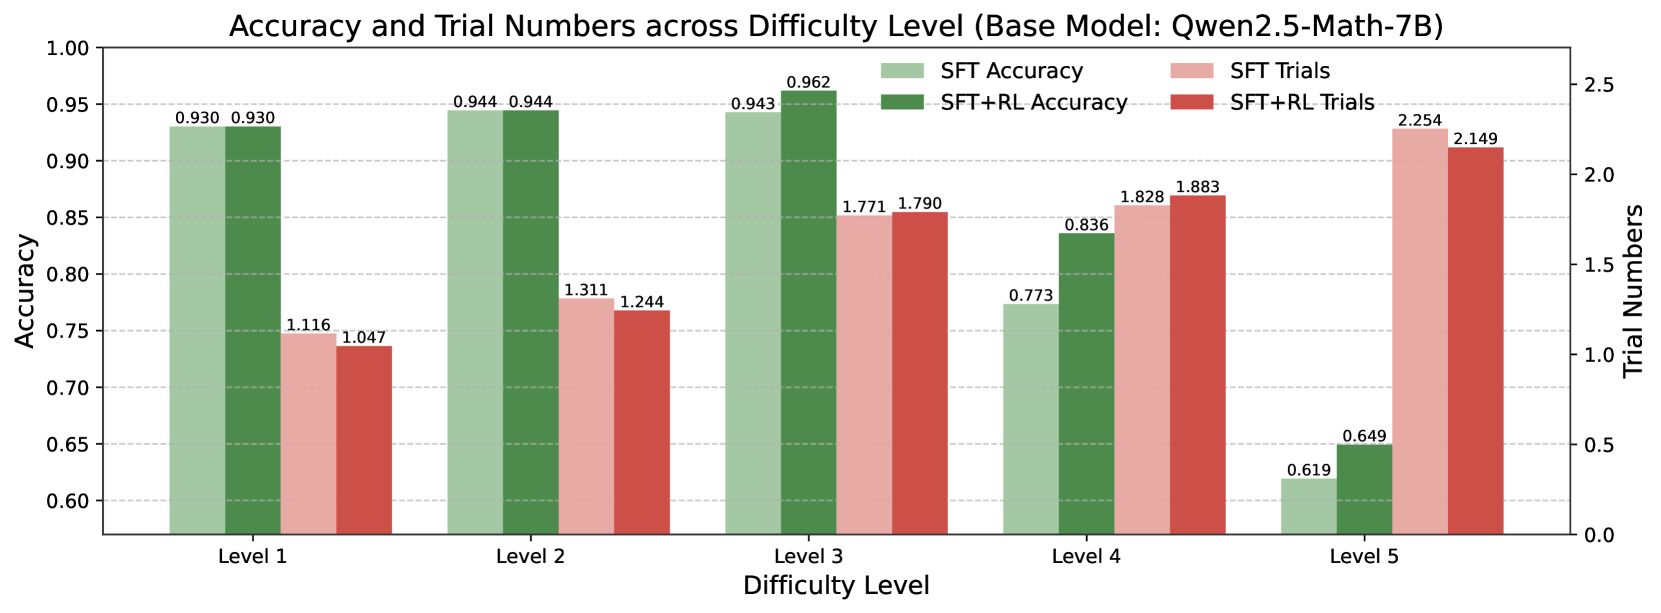
This bar chart compares the accuracy and trial numbers of a base model (Qwen2.5-Math-7B) across five difficulty levels (Level 1 to Level 5). It presents two sets of data for each difficulty level: accuracy achieved through Supervised Fine-Tuning (SFT) and accuracy achieved through SFT combined with Reinforcement Learning (SFT+RL), as well as the corresponding trial numbers for both methods. The chart uses bar graphs to represent accuracy and a secondary y-axis to represent trial numbers.
### Components/Axes
* **Title:** Accuracy and Trial Numbers across Difficulty Level (Base Model: Qwen2.5-Math-7B) - positioned at the top-center.
* **X-axis:** Difficulty Level (Level 1, Level 2, Level 3, Level 4, Level 5) - positioned at the bottom.
* **Y-axis (left):** Accuracy - ranging from approximately 0.60 to 1.00.
* **Y-axis (right):** Trial Numbers - ranging from 0.0 to 2.5.
* **Legend (top-right):**
* SFT Accuracy (Green)
* SFT Trials (Light Green)
* SFT+RL Accuracy (Red)
* SFT+RL Trials (Light Red)
### Detailed Analysis
The chart consists of paired bar graphs for each difficulty level. The left bar in each pair represents accuracy, and the right bar represents trial numbers.
**Level 1:**
* SFT Accuracy: Approximately 0.930
* SFT Trials: Approximately 0.930
* SFT+RL Accuracy: Approximately 1.116
* SFT+RL Trials: Approximately 1.047
**Level 2:**
* SFT Accuracy: Approximately 0.944
* SFT Trials: Approximately 0.944
* SFT+RL Accuracy: Approximately 1.311
* SFT+RL Trials: Approximately 1.244
**Level 3:**
* SFT Accuracy: Approximately 0.962
* SFT Trials: Approximately 0.943
* SFT+RL Accuracy: Approximately 1.771
* SFT+RL Trials: Approximately 1.790
**Level 4:**
* SFT Accuracy: Approximately 0.773
* SFT Trials: Approximately 0.836
* SFT+RL Accuracy: Approximately 1.828
* SFT+RL Trials: Approximately 1.883
**Level 5:**
* SFT Accuracy: Approximately 0.649
* SFT Trials: Approximately 0.619
* SFT+RL Accuracy: Approximately 2.254
* SFT+RL Trials: Approximately 2.149
**Trends:**
* **SFT Accuracy:** Generally high across all difficulty levels, with a slight decrease at Level 5.
* **SFT+RL Accuracy:** Shows a clear increasing trend with difficulty level, peaking at Level 5.
* **SFT Trials:** Relatively stable across all difficulty levels.
* **SFT+RL Trials:** Increases with difficulty level, mirroring the trend in SFT+RL Accuracy.
### Key Observations
* SFT+RL consistently outperforms SFT in terms of accuracy, especially at higher difficulty levels.
* The trial numbers for SFT+RL increase significantly with difficulty, suggesting that more trials are needed to achieve higher accuracy with reinforcement learning.
* Accuracy for SFT decreases at Level 5, while SFT+RL accuracy continues to increase. This suggests that reinforcement learning becomes more crucial as the difficulty increases.
* The SFT+RL accuracy at Level 1 is higher than 1.0, which is not possible. This is likely an error in the data or visualization.
### Interpretation
The data suggests that combining Supervised Fine-Tuning with Reinforcement Learning significantly improves the performance of the Qwen2.5-Math-7B model, particularly on more challenging tasks. The increasing trial numbers for SFT+RL indicate that reinforcement learning requires more iterations to converge to optimal solutions. The anomaly at Level 1 for SFT+RL accuracy should be investigated further. The chart demonstrates the benefits of incorporating reinforcement learning into the training process for complex mathematical problem-solving, and highlights the importance of considering the difficulty level when evaluating model performance. The relationship between difficulty level and trial numbers suggests a trade-off between accuracy and computational cost. As the difficulty increases, more trials are needed to achieve higher accuracy, which may require more resources and time.