# Technical Document Extraction: Data Pipelines Diagram
## 1. Overview
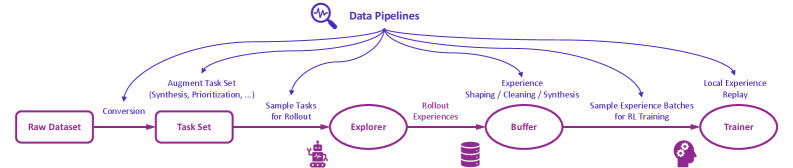
This image is a technical flow diagram illustrating a Reinforcement Learning (RL) or machine learning data architecture. It depicts the lifecycle of data from a raw state through task generation, exploration, buffering, and finally to a training module. The entire process is overseen by a centralized "Data Pipelines" management layer.
The diagram uses a purple color scheme for all text, shapes, and icons.
---
## 2. Component Isolation
### Header Region
- **Title:** Data Pipelines
- **Icon:** A magnifying glass containing a pulse/waveform line, positioned to the left of the title.
- **Function:** This acts as a central hub. Seven curved arrows originate from a single point beneath the title and point downward to various stages and transitions in the main flow, indicating that the "Data Pipelines" control or monitor every step of the process.
### Main Flow (Left to Right)
The core logic follows a linear progression of five main nodes connected by horizontal arrows.
| Order | Node Shape | Label | Associated Icon |
| :--- | :--- | :--- | :--- |
| 1 | Rounded Rectangle | **Raw Dataset** | N/A |
| 2 | Rounded Rectangle | **Task Set** | N/A |
| 3 | Oval | **Explorer** | A small robot icon (positioned below) |
| 4 | Oval | **Buffer** | A database/stack icon (positioned below) |
| 5 | Oval | **Trainer** | A human head profile with gears (positioned below) |
---
## 3. Process Flow and Transitions
The transitions between nodes are labeled with specific actions. Additionally, the "Data Pipelines" hub provides specific interventions at these stages.
### Stage 1: Data Ingestion
* **Transition:** From **Raw Dataset** to **Task Set**.
* **Action Label:** `Conversion`
* **Pipeline Intervention:** An arrow points to the `Conversion` step.
### Stage 2: Task Management
* **Node:** **Task Set**
* **Pipeline Intervention:** `Augment Task Set (Synthesis, Prioritization, ...)`
* **Transition:** From **Task Set** to **Explorer**.
* **Action Label:** `Sample Tasks for Rollout` (An arrow from the Pipeline hub points specifically to this transition).
### Stage 3: Exploration/Data Collection
* **Node:** **Explorer** (represented by a robot icon).
* **Transition:** From **Explorer** to **Buffer**.
* **Action Label:** `Rollout Experiences`
### Stage 4: Data Storage and Refinement
* **Node:** **Buffer** (represented by a database icon).
* **Pipeline Intervention:** `Experience Shaping / Cleaning / Synthesis` (An arrow from the Pipeline hub points directly to the Buffer node).
* **Transition:** From **Buffer** to **Trainer**.
* **Action Label:** `Sample Experience Batches for RL Training` (An arrow from the Pipeline hub points to this transition).
### Stage 5: Model Training
* **Node:** **Trainer** (represented by a brain/gears icon).
* **Pipeline Intervention:** `Local Experience Replay` (An arrow from the Pipeline hub points directly to the Trainer node).
---
## 4. Summary of Data Pipeline Interventions
The "Data Pipelines" entity performs the following seven distinct functions (mapped to the seven arrows):
1. **Conversion** of raw data.
2. **Augmentation** of tasks (Synthesis and Prioritization).
3. **Sampling** tasks for the rollout phase.
4. **Monitoring** the rollout of experiences.
5. **Shaping, Cleaning, and Synthesizing** experiences within the buffer.
6. **Sampling** specific batches for the training phase.
7. **Managing** local experience replay within the trainer.