\n
## Diagram: Data Pipelines
### Overview
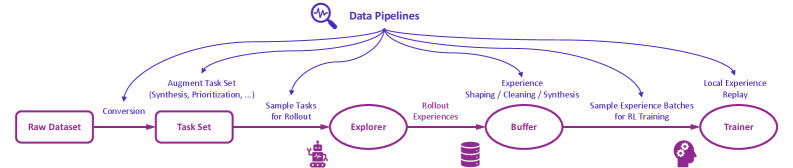
The image is a diagram illustrating a data pipeline, likely within a reinforcement learning (RL) context. It depicts the flow of data from a "Raw Dataset" through several processing stages to a "Trainer". The pipeline is visually represented as a series of connected boxes and branching paths, with a central "Data Pipelines" node at the top.
### Components/Axes
The diagram consists of the following components, arranged horizontally from left to right:
* **Raw Dataset:** The initial data source.
* **Task Set:** Data after "Conversion" from the Raw Dataset.
* **Augment Task Set (Synthesis, Prioritization, ...):** A branch off the Task Set, indicating data augmentation.
* **Explorer:** Receives "Sample Tasks for Rollout".
* **Rollout Experiences:** Output from the Explorer.
* **Buffer:** Stores "Experience Shaping / Cleaning / Synthesis".
* **Trainer:** Receives "Sample Experience Batches for RL Training".
* **Local Experience Replay:** A branch off the Trainer.
* **Data Pipelines:** A central node at the top, from which multiple connections originate.
The diagram also includes labels describing the data flow between components.
### Detailed Analysis or Content Details
The diagram shows a linear flow from "Raw Dataset" to "Task Set" to "Explorer" to "Buffer" to "Trainer". There are branching paths originating from "Task Set" and "Trainer".
1. **Raw Dataset to Task Set:** A direct connection labeled "Conversion".
2. **Task Set to Augment Task Set:** A branch labeled "Augment Task Set (Synthesis, Prioritization, ...)".
3. **Task Set to Explorer:** A direct connection labeled "Sample Tasks for Rollout".
4. **Explorer to Rollout Experiences:** The connection is implied, representing the output of the Explorer.
5. **Rollout Experiences to Buffer:** A direct connection labeled "Rollout Experiences".
6. **Buffer to Trainer:** A direct connection labeled "Experience Shaping / Cleaning / Synthesis".
7. **Trainer to Local Experience Replay:** A branch labeled "Local Experience Replay".
8. **Buffer to Trainer:** A direct connection labeled "Sample Experience Batches for RL Training".
9. **Data Pipelines to all components:** Multiple connections originate from the "Data Pipelines" node, visually representing the overarching process.
### Key Observations
The diagram highlights the key stages in a typical RL data pipeline: data acquisition, task generation, exploration, experience storage, and training. The branching paths suggest that data can be augmented and experiences can be replayed to improve learning. The "Data Pipelines" node emphasizes the overall system architecture.
### Interpretation
This diagram illustrates a common architecture for reinforcement learning systems. The "Raw Dataset" represents the environment or source of information. The "Task Set" represents the problems or scenarios the agent will learn to solve. The "Explorer" interacts with the environment to generate experiences. The "Buffer" stores these experiences for later use. The "Trainer" uses the experiences to update the agent's policy. The "Local Experience Replay" suggests a mechanism for reusing past experiences to improve learning efficiency. The "Data Pipelines" node signifies the overall orchestration of these components. The diagram suggests a focus on efficient data handling and reuse, which are crucial for successful RL applications. The inclusion of "Synthesis, Prioritization" in the augmentation step indicates a desire to intelligently select and generate training data.