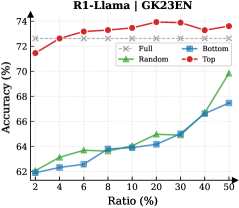
## Line Chart: R1-Llama | GK23EN Accuracy vs. Ratio
### Overview
This line chart displays the accuracy of different sampling methods (Full, Bottom, Random, Top) for the R1-Llama model (GK23EN) as a function of the ratio of data used. The x-axis represents the ratio, expressed as a percentage, and the y-axis represents the accuracy, also expressed as a percentage.
### Components/Axes
* **Title:** R1-Llama | GK23EN
* **X-axis Label:** Ratio (%)
* **Y-axis Label:** Accuracy (%)
* **Legend:**
* Full (represented by a dashed grey line with 'x' markers)
* Bottom (represented by a solid blue line with square markers)
* Random (represented by a solid green line with triangle markers)
* Top (represented by a solid red line with circle markers)
* **X-axis Markers:** 2, 4, 6, 8, 10, 20, 30, 40, 50
* **Y-axis Scale:** Ranges from approximately 62% to 74%.
### Detailed Analysis
Here's a breakdown of each data series and their trends:
* **Top (Red Line):** This line generally slopes upward from 2% to 30% ratio, then plateaus and slightly declines.
* Ratio 2%: Accuracy ≈ 72.4%
* Ratio 4%: Accuracy ≈ 73.0%
* Ratio 6%: Accuracy ≈ 73.4%
* Ratio 8%: Accuracy ≈ 73.6%
* Ratio 10%: Accuracy ≈ 73.8%
* Ratio 20%: Accuracy ≈ 74.0%
* Ratio 30%: Accuracy ≈ 74.2%
* Ratio 40%: Accuracy ≈ 73.4%
* Ratio 50%: Accuracy ≈ 73.8%
* **Bottom (Blue Line):** This line shows a consistent upward trend throughout the entire range.
* Ratio 2%: Accuracy ≈ 62.8%
* Ratio 4%: Accuracy ≈ 63.6%
* Ratio 6%: Accuracy ≈ 64.0%
* Ratio 8%: Accuracy ≈ 64.4%
* Ratio 10%: Accuracy ≈ 64.6%
* Ratio 20%: Accuracy ≈ 65.2%
* Ratio 30%: Accuracy ≈ 65.8%
* Ratio 40%: Accuracy ≈ 67.2%
* Ratio 50%: Accuracy ≈ 67.8%
* **Random (Green Line):** This line exhibits a slow, steady increase up to 30%, then a steep increase from 30% to 50%.
* Ratio 2%: Accuracy ≈ 62.4%
* Ratio 4%: Accuracy ≈ 63.2%
* Ratio 6%: Accuracy ≈ 63.8%
* Ratio 8%: Accuracy ≈ 64.2%
* Ratio 10%: Accuracy ≈ 64.5%
* Ratio 20%: Accuracy ≈ 65.0%
* Ratio 30%: Accuracy ≈ 65.6%
* Ratio 40%: Accuracy ≈ 68.2%
* Ratio 50%: Accuracy ≈ 70.2%
* **Full (Grey Dashed Line):** This line remains relatively flat throughout the entire range, fluctuating around 72.5%.
* Ratio 2%: Accuracy ≈ 72.6%
* Ratio 4%: Accuracy ≈ 72.8%
* Ratio 6%: Accuracy ≈ 72.6%
* Ratio 8%: Accuracy ≈ 72.4%
* Ratio 10%: Accuracy ≈ 72.4%
* Ratio 20%: Accuracy ≈ 72.6%
* Ratio 30%: Accuracy ≈ 72.4%
* Ratio 40%: Accuracy ≈ 72.2%
* Ratio 50%: Accuracy ≈ 72.4%
### Key Observations
* The "Top" sampling method consistently achieves the highest accuracy, particularly at higher ratios.
* The "Bottom" sampling method shows a steady improvement in accuracy as the ratio increases, but remains significantly lower than the "Top" method.
* The "Random" sampling method demonstrates a delayed but substantial increase in accuracy at higher ratios (40% and 50%).
* The "Full" sampling method maintains a relatively constant accuracy, suggesting it is not significantly affected by the ratio of data used.
### Interpretation
The chart suggests that the "Top" sampling method is the most effective for the R1-Llama model (GK23EN) in terms of achieving high accuracy. The "Bottom" method provides a consistent, albeit lower, level of accuracy. The "Random" method's late surge in accuracy indicates that a larger sample size is crucial for its performance. The "Full" method's stability suggests it may be less sensitive to data quantity, potentially due to its comprehensive nature.
The differences in performance between the sampling methods likely stem from the distribution of information within the dataset. The "Top" method may be prioritizing the most informative data points, leading to higher accuracy. The "Random" method's improvement with increased ratio suggests it benefits from a larger, more representative sample. The "Full" method's consistent performance could be attributed to its inclusion of all available data, mitigating the impact of sample size.
The plateauing of the "Top" method's accuracy at higher ratios suggests a point of diminishing returns, where adding more data does not significantly improve performance. This could indicate that the model has reached its maximum potential with the available data and sampling strategy.