## Line Chart: R1-Llama | GK23EN Accuracy vs. Ratio
### Overview
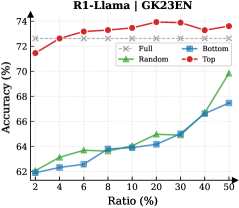
The chart compares the accuracy performance of four methods ("Full," "Bottom," "Random," "Top") across varying ratios (2% to 50%). Accuracy is measured on the y-axis (62%–74%), while the x-axis represents the ratio percentage. The "Full" method shows the highest baseline accuracy, while "Random" demonstrates the steepest improvement with increasing ratio.
### Components/Axes
- **X-axis (Ratio %)**: Increments of 2% from 2% to 50%.
- **Y-axis (Accuracy %)**: Range from 62% to 74%.
- **Legend**: Positioned on the right, with four entries:
- **Full**: Dashed gray line with star markers.
- **Bottom**: Solid blue line with square markers.
- **Random**: Solid green line with triangle markers.
- **Top**: Solid red line with circle markers.
### Detailed Analysis
1. **Full (Gray Stars)**:
- Starts at ~72% accuracy at 2% ratio.
- Remains relatively flat, peaking at ~73.5% by 50% ratio.
- Minimal fluctuation throughout.
2. **Bottom (Blue Squares)**:
- Begins at ~62% accuracy at 2% ratio.
- Gradual upward trend, reaching ~67.5% at 50% ratio.
- Linear progression with no sharp changes.
3. **Random (Green Triangles)**:
- Starts at ~62% accuracy at 2% ratio.
- Steep upward trajectory, reaching ~69.5% at 50% ratio.
- Accelerates significantly between 20% and 50% ratio.
4. **Top (Red Circles)**:
- Begins at ~71% accuracy at 2% ratio.
- Consistent upward trend, peaking at ~73.5% by 50% ratio.
- Slight dip at 40% ratio (~73%) before recovering.
### Key Observations
- **Top vs. Full**: The "Top" method closely matches the "Full" method's performance, suggesting comparable effectiveness despite potential differences in implementation.
- **Random's Surge**: The "Random" method shows the most dramatic improvement (7.5% gain from 2% to 50% ratio), indicating sensitivity to ratio increases.
- **Bottom's Steady Climb**: The "Bottom" method exhibits the slowest growth (5.5% gain), implying limited responsiveness to ratio changes.
- **Convergence at 50%**: All methods except "Full" approach ~67–70% accuracy at maximum ratio, suggesting diminishing returns for non-"Full" approaches.
### Interpretation
The data highlights trade-offs between method complexity and scalability:
- **"Full" Method**: Likely represents a resource-intensive baseline (e.g., full model training) with stable performance, ideal for high-stakes applications.
- **"Top" Method**: A near-optimal alternative to "Full," possibly optimized for efficiency without significant accuracy loss.
- **"Random" Method**: Demonstrates high potential for improvement with increased ratio, suggesting it may leverage stochastic processes (e.g., random sampling) that benefit from larger datasets.
- **"Bottom" Method**: Least responsive to ratio changes, possibly indicating a fundamental limitation in its design (e.g., fixed feature set).
The chart underscores the importance of method selection based on resource constraints and performance requirements. While "Full" and "Top" prioritize stability, "Random" offers a cost-effective path to higher accuracy with sufficient ratio investment.