## Logical Relationship Diagram: Data Tables and Set Operations
### Overview
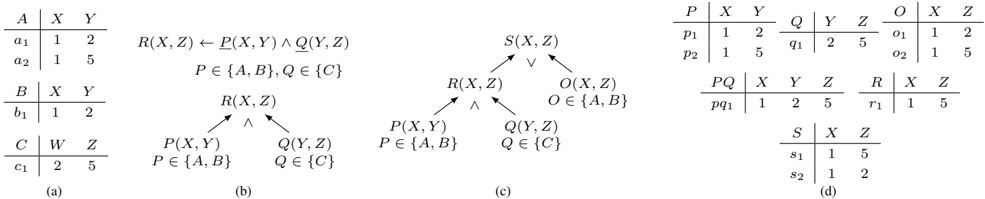
The image presents a technical diagram illustrating logical relationships between data tables (A, B, C, P, Q, R, S, O) through set operations (∧, ∨) and subset constraints. It combines tabular data with formal logic notation to demonstrate how relationships are derived and combined.
### Components/Axes
1. **Tables**:
- **A**: Columns X, Y with entries a1(1,2), a2(1,5)
- **B**: Columns X, Y with entry b1(1,2)
- **C**: Columns W, Z with entry c1(2,5)
- **P**: Columns X, Y with entries p1(1,2), p2(1,5)
- **Q**: Columns Y, Z with entry q1(2,5)
- **O**: Columns X, Z with entries o1(1,2), o2(1,5)
- **R**: Columns X, Z with entry r1(1,5)
- **S**: Columns X, Z with entries s1(1,5), s2(1,2)
2. **Logical Relationships**:
- R(X,Z) = P(X,Y) ∧ Q(Y,Z) where P ∈ {A,B}, Q ∈ {C}
- S(X,Z) = R(X,Z) ∨ O(X,Z) where O ∈ {A,B}
3. **Set Constraints**:
- P ∈ {A,B} (P is subset of A or B)
- Q ∈ {C} (Q is subset of C)
- O ∈ {A,B} (O is subset of A or B)
### Detailed Analysis
#### Section (a)
- **Tables A/B/C**:
- A: X=1 maps to Y=2 (a1) and Y=5 (a2)
- B: X=1 maps to Y=2 (b1)
- C: W=2 maps to Z=5 (c1)
- **Formula**: R(X,Z) is defined as the intersection of P(X,Y) and Q(Y,Z) with P from {A,B} and Q from {C}
#### Section (b)
- **Diagram Flow**:
- R(X,Z) splits into P(X,Y) (from A/B) and Q(Y,Z) (from C)
- P(X,Y) contains p1(1,2), p2(1,5)
- Q(Y,Z) contains q1(2,5)
- R(X,Z) combines these to form r1(1,5)
#### Section (c)
- **New Relationship**:
- S(X,Z) = R(X,Z) ∨ O(X,Z)
- O(X,Z) contains o1(1,2), o2(1,5)
- S(X,Z) combines R(1,5) and O(1,2/1,5) to form s1(1,5), s2(1,2)
#### Section (d)
- **Final Tables**:
- P: p1(1,2), p2(1,5)
- Q: q1(2,5)
- O: o1(1,2), o2(1,5)
- R: r1(1,5)
- S: s1(1,5), s2(1,2)
### Key Observations
1. **Data Consistency**:
- All X values are 1 except for W=2 in table C
- Z values are either 2 or 5 across all tables
- Y values are 2 or 5, matching Z values
2. **Logical Operations**:
- AND (∧) operation in R(X,Z) requires matching Y values between P and Q
- OR (∨) operation in S(X,Z) combines results from R and O
3. **Set Constraints**:
- P and O are restricted to subsets of {A,B}
- Q is restricted to subset of {C}
### Interpretation
This diagram demonstrates how relational data can be combined through logical operations while maintaining set constraints. The relationships show:
1. **Data Integration**: R(X,Z) combines X-Y-Z relationships from A/B and C tables through intersection
2. **Alternative Paths**: S(X,Z) provides alternative combinations through union of R and O
3. **Constraint Enforcement**: Set membership restrictions (P∈{A,B}, Q∈{C}) ensure data provenance
The structure suggests a formal system for:
- Data fusion from multiple sources
- Constraint-based relationship derivation
- Alternative solution generation through logical disjunction
The consistent use of X=1 across most entries (except W=2 in C) indicates a possible focus on a specific data subset or normalization process.