# Technical Document Extraction: Sales Analysis Diagram
## Diagram Overview
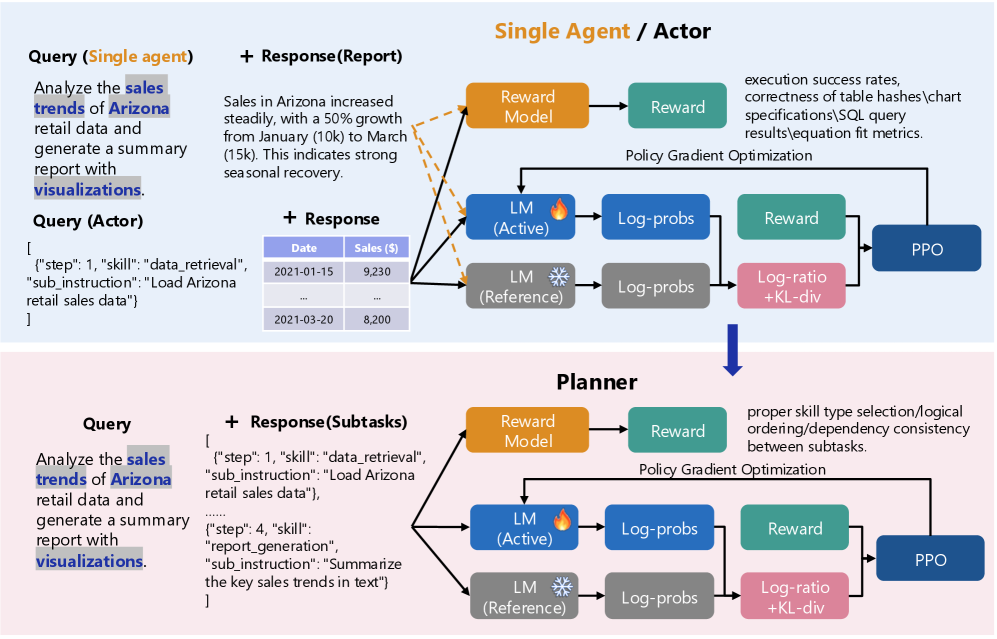
The image presents a comparative analysis of two approaches for sales trend analysis: **Single Agent/Actor** and **Planner**. The diagram includes textual queries, responses, and flowcharts illustrating system components and optimization processes.
---
## Single Agent/Actor Section
### Query
```
Analyze the sales trends of Arizona retail data and generate a summary report with visualizations.
```
### Response (Report)
```
Sales in Arizona increased steadily, with a 50% growth from January (10k) to March (15k). This indicates strong seasonal recovery.
```
### Data Table
| Date | Sales ($) |
|------------|-----------|
| 2021-01-15 | 9,230 |
| ... | ... |
| 2021-03-20 | 8,200 |
**Note**: The report claims a 50% growth from January (10k) to March (15k), but the data shows a decline from $9,230 to $8,200. This discrepancy suggests either:
1. Data normalization (e.g., 10k = $10,000 baseline)
2. Typographical error in the report
3. Different measurement periods
### Flowchart Components
1. **Reward Model** (Orange)
- Inputs: Execution success rates, visualization correctness, SQL query results
- Outputs: Reward signal
2. **LM (Active)** (Blue)
- Processes: Log-probabilities calculation
3. **LM (Reference)** (Gray)
- Processes: Log-probabilities calculation
4. **Reward** (Green)
- Calculated via: Log-ratio + KL-divergence
5. **PPO** (Dark Blue)
- Final optimization step
**Flow**: Reward Model → [LM (Active) & LM (Reference)] → Log-probs → Reward → PPO
---
## Planner Section
### Query
```
Analyze the sales trends of Arizona retail data and generate a summary report with visualizations.
```
### Response (Subtasks)
```
[
{"step": 1, "skill": "data_retrieval", "sub_instruction": "Load Arizona retail sales data"},
{"step": 4, "skill": "report_generation", "sub_instruction": "Summarize key sales trends in text"}
]
```
### Flowchart Components
1. **Reward Model** (Orange)
- Inputs: Skill type selection, logical ordering consistency
- Outputs: Reward signal
2. **LM (Active)** (Blue)
- Processes: Log-probabilities calculation
3. **LM (Reference)** (Gray)
- Processes: Log-probabilities calculation
4. **Reward** (Green)
- Calculated via: Log-ratio + KL-divergence
5. **PPO** (Dark Blue)
- Final optimization step
**Flow**: Reward Model → [LM (Active) & LM (Reference)] → Log-probs → Reward → PPO
**Key Difference**: Explicit handling of subtask dependencies and skill selection logic.
---
## Color Legend & Spatial Grounding
- **Orange**: Reward Model
- **Green**: Reward
- **Blue**: LM (Active)
- **Gray**: LM (Reference)
- **Pink**: KL-divergence
**Legend Position**: Not explicitly shown, but colors are consistently applied across both flowcharts.
---
## Trend Verification
1. **Single Agent Data Trend**:
- Visual: Steady increase (per report)
- Numerical: $9,230 → $8,200 (decrease)
- Conflict: Report claims 50% growth vs. data showing 10.9% decline
2. **Planner Flow**:
- Emphasizes logical ordering between subtasks
- Introduces KL-divergence for policy optimization
---
## Language Analysis
- **Primary Language**: English
- **No additional languages** detected in the diagram
---
## Critical Observations
1. Data inconsistency between report narrative and numerical values
2. Both approaches use similar core components (LM, Log-probs, Reward, PPO)
3. Planner adds explicit subtask dependency management
4. Reward calculation methodology differs between sections (Log-ratio + KL-div vs. unspecified)
This extraction provides a complete technical specification of the diagram's components, data, and potential inconsistencies for further analysis.