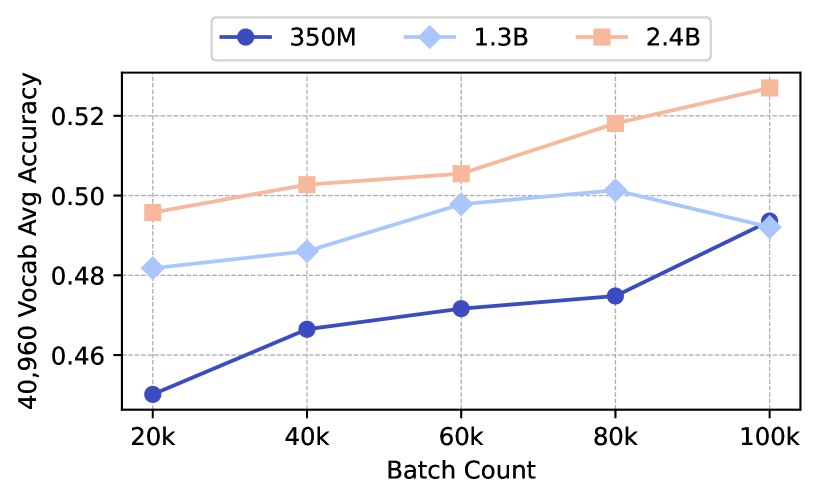
## Line Chart: Vocabulary Average Accuracy vs. Batch Count for Different Model Sizes
### Overview
The image is a line chart comparing the vocabulary average accuracy of three different model sizes (350M, 1.3B, and 2.4B) across varying batch counts. The x-axis represents the batch count, and the y-axis represents the 40,960 vocabulary average accuracy.
### Components/Axes
* **Title:** Implicitly, the chart compares vocabulary average accuracy vs. batch count for different model sizes.
* **X-axis:** Batch Count, with markers at 20k, 40k, 60k, 80k, and 100k.
* **Y-axis:** 40,960 Vocab Avg Accuracy, with markers at 0.46, 0.48, 0.50, and 0.52.
* **Legend:** Located at the top of the chart, it identifies the model sizes:
* Dark Blue: 350M
* Light Blue: 1.3B
* Light Orange: 2.4B
### Detailed Analysis
* **350M (Dark Blue):** The line starts at approximately 0.45 accuracy at 20k batch count and generally slopes upward.
* 20k: ~0.45
* 40k: ~0.467
* 60k: ~0.472
* 80k: ~0.475
* 100k: ~0.494
* **1.3B (Light Blue):** The line starts at approximately 0.482 accuracy at 20k batch count, increases to 60k, and then slightly decreases.
* 20k: ~0.482
* 40k: ~0.486
* 60k: ~0.498
* 80k: ~0.502
* 100k: ~0.493
* **2.4B (Light Orange):** The line starts at approximately 0.496 accuracy at 20k batch count and consistently slopes upward.
* 20k: ~0.496
* 40k: ~0.503
* 60k: ~0.506
* 80k: ~0.518
* 100k: ~0.528
### Key Observations
* The 2.4B model consistently outperforms the other two models in terms of vocabulary average accuracy across all batch counts.
* The 350M model has the lowest accuracy but shows a consistent upward trend.
* The 1.3B model's accuracy plateaus and slightly decreases at higher batch counts.
### Interpretation
The chart suggests that increasing model size generally leads to higher vocabulary average accuracy. The 2.4B model demonstrates the best performance, indicating that larger models can better capture the nuances of the vocabulary. The 1.3B model's plateauing performance at higher batch counts could indicate diminishing returns or a need for further optimization. The 350M model's consistent upward trend suggests that it could benefit from further training with higher batch counts, although it is unlikely to reach the performance levels of the larger models. The data highlights the trade-offs between model size, training effort, and achievable accuracy.