\n
## Line Chart: Vocabulary Accuracy vs. Batch Count
### Overview
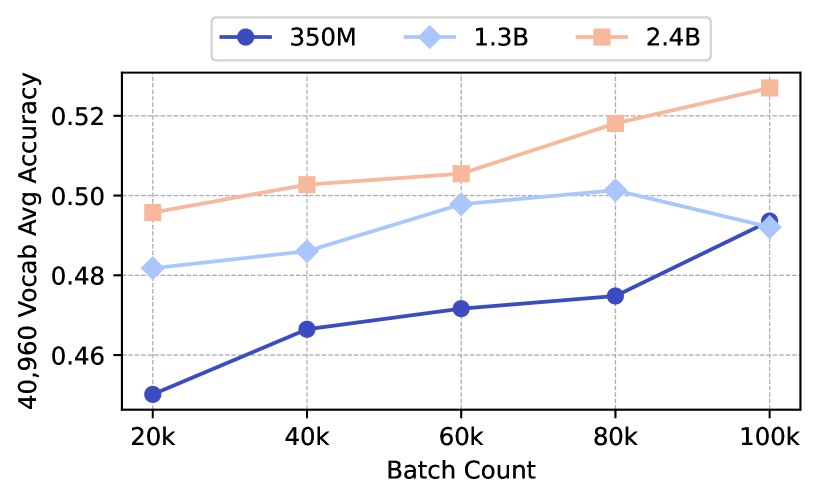
This line chart depicts the relationship between batch count and average vocabulary accuracy for three different model sizes: 350M, 1.3B, and 2.4B. The chart appears to be evaluating model performance as the batch size increases.
### Components/Axes
* **X-axis:** Batch Count (labeled at 20k, 40k, 60k, 80k, 100k)
* **Y-axis:** 40,960 Vocab Avg Accuracy (ranging approximately from 0.46 to 0.53)
* **Legend:** Located at the top-center of the chart.
* 350M (Dark Blue Line with Circle Markers)
* 1.3B (Light Blue Line with Diamond Markers)
* 2.4B (Peach/Light Orange Line with Square Markers)
* **Gridlines:** Present to aid in reading values.
### Detailed Analysis
Let's analyze each data series individually:
* **350M (Dark Blue):** The line slopes generally upward.
* At 20k Batch Count: Approximately 0.45 accuracy.
* At 40k Batch Count: Approximately 0.468 accuracy.
* At 60k Batch Count: Approximately 0.472 accuracy.
* At 80k Batch Count: Approximately 0.475 accuracy.
* At 100k Batch Count: Approximately 0.49 accuracy.
* **1.3B (Light Blue):** The line is relatively flat, with a slight downward trend.
* At 20k Batch Count: Approximately 0.483 accuracy.
* At 40k Batch Count: Approximately 0.49 accuracy.
* At 60k Batch Count: Approximately 0.502 accuracy.
* At 80k Batch Count: Approximately 0.501 accuracy.
* At 100k Batch Count: Approximately 0.495 accuracy.
* **2.4B (Peach/Light Orange):** The line slopes consistently upward.
* At 20k Batch Count: Approximately 0.498 accuracy.
* At 40k Batch Count: Approximately 0.508 accuracy.
* At 60k Batch Count: Approximately 0.518 accuracy.
* At 80k Batch Count: Approximately 0.525 accuracy.
* At 100k Batch Count: Approximately 0.533 accuracy.
### Key Observations
* The 2.4B model consistently exhibits the highest accuracy across all batch counts.
* The 350M model shows the lowest accuracy, but demonstrates the most significant improvement with increasing batch count.
* The 1.3B model's accuracy remains relatively stable, with a slight decrease at the highest batch count.
* The gap in accuracy between the 2.4B model and the other two models widens as the batch count increases.
### Interpretation
The data suggests that increasing the model size (from 350M to 2.4B) generally leads to higher vocabulary accuracy. Furthermore, increasing the batch count appears to benefit the smaller models (350M) more significantly than the larger models (2.4B). The 1.3B model shows limited sensitivity to batch count changes.
This could indicate that larger models have already reached a point of diminishing returns with respect to batch size, while smaller models still benefit from increased data exposure per batch. The relatively stable performance of the 1.3B model suggests it may be operating in a region where batch size has a minimal impact on accuracy. The consistent upward trend of the 2.4B model suggests it continues to improve with larger batch sizes, but at a decreasing rate. The choice of batch size should be considered in relation to model size to optimize performance.