## Line Chart: Model Size vs. Vocabulary Accuracy Across Batch Sizes
### Overview
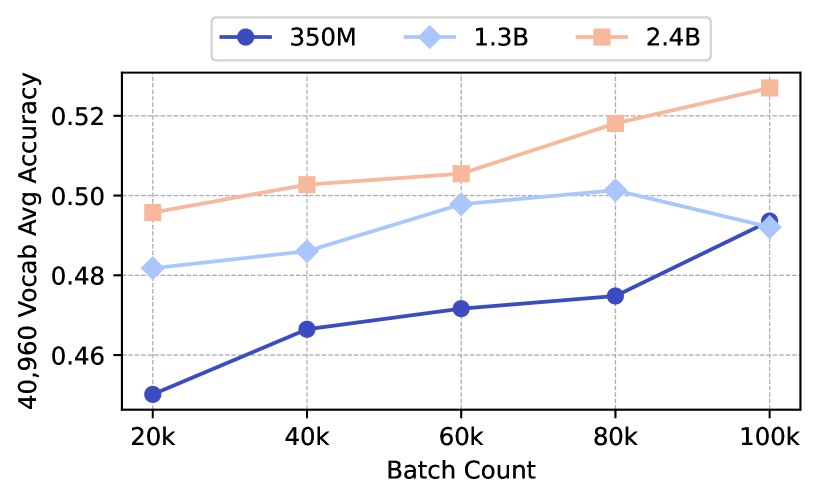
The chart illustrates the relationship between batch count (20k to 100k) and average vocabulary accuracy (40,960 Vocab Avg Accuracy) for three model sizes: 350M, 1.3B, and 2.4B. The y-axis represents accuracy (0.45–0.53 range), while the x-axis shows batch counts. Three distinct lines (blue, light blue, orange) correspond to the model sizes, with the legend positioned in the top-right corner.
### Components/Axes
- **X-axis (Batch Count)**: Labeled "Batch Count" with ticks at 20k, 40k, 60k, 80k, and 100k.
- **Y-axis (Accuracy)**: Labeled "40,960 Vocab Avg Accuracy" with increments of 0.02 (0.45–0.53).
- **Legend**: Top-right corner, associating:
- Blue circle: 350M
- Light blue diamond: 1.3B
- Orange square: 2.4B
### Detailed Analysis
#### 350M Model (Blue Line)
- **Trend**: Steady upward slope from ~0.45 (20k) to ~0.49 (100k).
- **Data Points**:
- 20k: ~0.45
- 40k: ~0.465
- 60k: ~0.47
- 80k: ~0.475
- 100k: ~0.49
#### 1.3B Model (Light Blue Line)
- **Trend**: Initial rise to a peak at 80k (~0.50), then slight decline to ~0.49 (100k).
- **Data Points**:
- 20k: ~0.48
- 40k: ~0.485
- 60k: ~0.495
- 80k: ~0.50
- 100k: ~0.49
#### 2.4B Model (Orange Line)
- **Trend**: Consistent upward trajectory from ~0.495 (20k) to ~0.525 (100k).
- **Data Points**:
- 20k: ~0.495
- 40k: ~0.505
- 60k: ~0.51
- 80k: ~0.515
- 100k: ~0.525
### Key Observations
1. **Model Size Correlation**: Larger models (2.4B) consistently outperform smaller ones across all batch sizes.
2. **Batch Count Impact**: All models show improved accuracy with larger batches, but the 2.4B model exhibits the strongest scaling.
3. **1.3B Model Anomaly**: Peaks at 80k before a minor drop, suggesting potential overfitting or diminishing returns at higher batch counts.
4. **350M Model Limitation**: Shows the least improvement, indicating lower capacity to leverage larger batches.
### Interpretation
The data demonstrates a clear trade-off between model size and batch efficiency. The 2.4B model achieves the highest accuracy (~0.525 at 100k), suggesting it scales optimally with batch size. The 1.3B model’s peak at 80k implies an optimal batch size before performance degradation, possibly due to computational constraints or overfitting. The 350M model’s linear growth highlights its limited ability to benefit from larger batches. These trends underscore the importance of model architecture and batch sizing in balancing accuracy and resource utilization.