# Technical Data Extraction: Performance Heatmaps for TriviaQA and Natural Questions
This document contains a detailed extraction of data from two side-by-side heatmaps illustrating model accuracy (Acc) across two different datasets: **TriviaQA** (left) and **Natural Questions (NaturalQ.)** (right).
## 1. Document Structure and Components
The image is divided into two main regions, each containing a heatmap with a shared coordinate system for the axes.
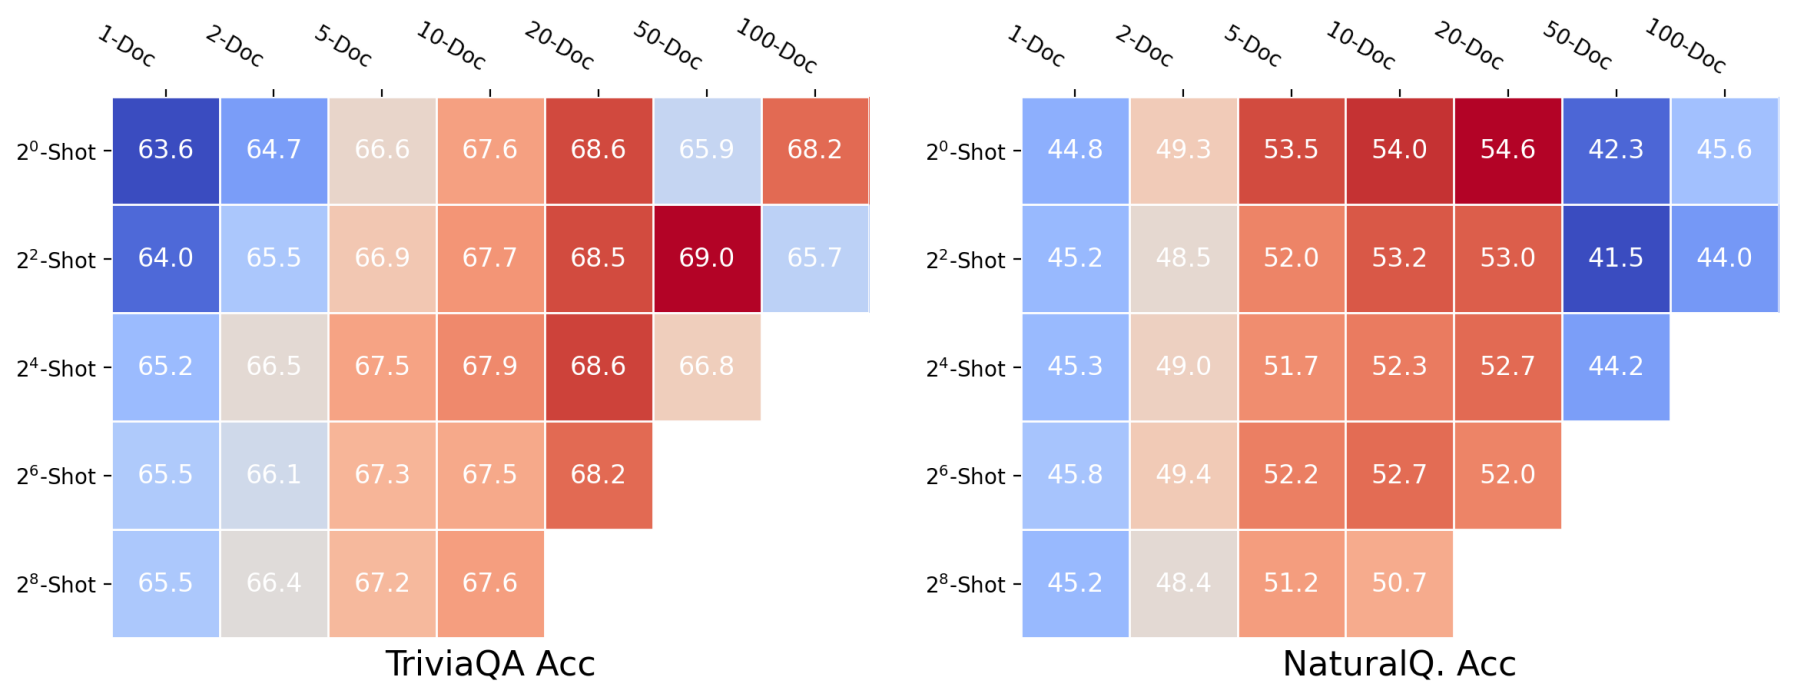
* **X-Axis (Top):** Represents the number of documents used, labeled as `1-Doc`, `2-Doc`, `5-Doc`, `10-Doc`, `20-Doc`, `50-Doc`, and `100-Doc`.
* **Y-Axis (Left):** Represents the number of "shots" (examples) provided, labeled in powers of 2: $2^0$-Shot, $2^2$-Shot, $2^4$-Shot, $2^6$-Shot, and $2^8$-Shot.
* **Color Gradient:** A diverging color scale is used where **Dark Red** indicates the highest accuracy values, **White/Beige** indicates median values, and **Dark Blue** indicates the lowest accuracy values.
---
## 2. Region 1: TriviaQA Acc (Left Chart)
### Trend Analysis
The TriviaQA heatmap shows a general trend where accuracy improves as the number of documents increases from 1 to 20. Performance peaks around the 20-Doc to 50-Doc range. Interestingly, performance appears relatively stable or slightly improves as the number of shots increases for low document counts, but the highest overall performance (69.0) is achieved at $2^2$-Shot with 50 documents.
### Data Table: TriviaQA Accuracy (%)
| Shots \ Docs | 1-Doc | 2-Doc | 5-Doc | 10-Doc | 20-Doc | 50-Doc | 100-Doc |
| :--- | :---: | :---: | :---: | :---: | :---: | :---: | :---: |
| **$2^0$-Shot** | 63.6 | 64.7 | 66.6 | 67.6 | 68.6 | 65.9 | 68.2 |
| **$2^2$-Shot** | 64.0 | 65.5 | 66.9 | 67.7 | 68.5 | 69.0 | 65.7 |
| **$2^4$-Shot** | 65.2 | 66.5 | 67.5 | 67.9 | 68.6 | 66.8 | [N/A] |
| **$2^6$-Shot** | 65.5 | 66.1 | 67.3 | 67.5 | 68.2 | [N/A] | [N/A] |
| **$2^8$-Shot** | 65.5 | 66.4 | 67.2 | 67.6 | [N/A] | [N/A] | [N/A] |
---
## 3. Region 2: NaturalQ. Acc (Right Chart)
### Trend Analysis
The Natural Questions heatmap displays a distinct "peak" performance zone. Accuracy increases significantly when moving from 1-Doc to 20-Doc, reaching a maximum of 54.6 at $2^0$-Shot/20-Doc. However, there is a sharp performance degradation (indicated by the shift to dark blue) when moving to 50-Doc and 100-Doc for the lower shot counts, suggesting a potential "distraction" or context window issue at those scales for this specific dataset.
### Data Table: Natural Questions Accuracy (%)
| Shots \ Docs | 1-Doc | 2-Doc | 5-Doc | 10-Doc | 20-Doc | 50-Doc | 100-Doc |
| :--- | :---: | :---: | :---: | :---: | :---: | :---: | :---: |
| **$2^0$-Shot** | 44.8 | 49.3 | 53.5 | 54.0 | 54.6 | 42.3 | 45.6 |
| **$2^2$-Shot** | 45.2 | 48.5 | 52.0 | 53.2 | 53.0 | 41.5 | 44.0 |
| **$2^4$-Shot** | 45.3 | 49.0 | 51.7 | 52.3 | 52.7 | 44.2 | [N/A] |
| **$2^6$-Shot** | 45.8 | 49.4 | 52.2 | 52.7 | 52.0 | [N/A] | [N/A] |
| **$2^8$-Shot** | 45.2 | 48.4 | 51.2 | 50.7 | [N/A] | [N/A] | [N/A] |
---
## 4. Summary of Observations
* **Dataset Difficulty:** TriviaQA shows higher absolute accuracy scores (ranging from 63.6 to 69.0) compared to Natural Questions (ranging from 41.5 to 54.6).
* **Optimal Document Count:** For both datasets, the 20-Doc column consistently shows high performance (deep orange/red).
* **Scaling Limitations:** Both charts contain empty cells (white space) in the bottom-right corners, indicating that data for high-shot/high-document combinations (e.g., $2^8$-Shot with 100-Doc) was either not collected or is not applicable, likely due to context length constraints of the model being tested.
* **Anomalies:** In the NaturalQ. chart, the performance drop at 50-Doc and 100-Doc for $2^0$ and $2^2$ shots is much more pronounced than in the TriviaQA chart.