## Line Chart: Model Performance on ARC and DROP Benchmarks
### Overview
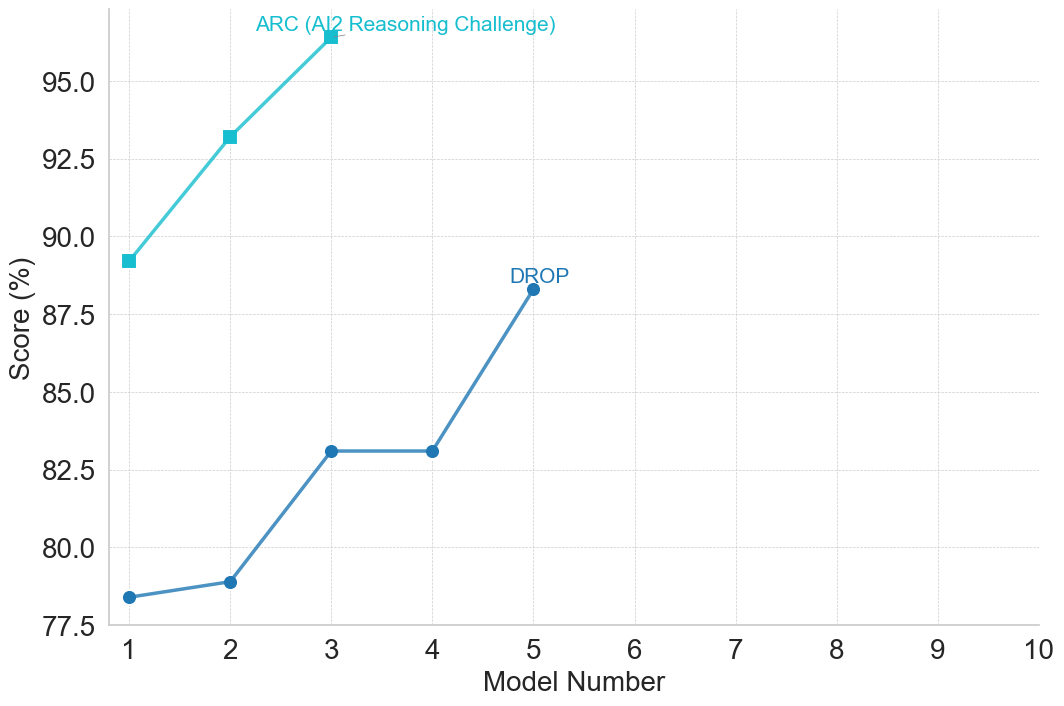
This image is a line chart displaying the performance scores of sequential AI models on two specific benchmarks: ARC (AI2 Reasoning Challenge) and DROP. The chart tracks the progression of scores across different model iterations, showing a general upward trend in performance for both metrics, though the data series terminate at different points on the x-axis.
*Language Declaration:* The text in the image is entirely in English.
### Components/Axes
**1. X-Axis (Bottom)**
* **Label:** "Model Number" (Centered below the axis line).
* **Scale/Markers:** Linear scale with solid tick marks at integer intervals from 1 to 10.
* **Grid:** Faint, dashed light-gray vertical lines extend upward from each integer tick mark.
**2. Y-Axis (Left)**
* **Label:** "Score (%)" (Rotated 90 degrees counter-clockwise, centered vertically along the axis).
* **Scale/Markers:** Linear scale starting at 77.5 and ending at 95.0, with tick marks at intervals of 2.5 (77.5, 80.0, 82.5, 85.0, 87.5, 90.0, 92.5, 95.0).
* **Grid:** Faint, dashed light-gray horizontal lines extend rightward from each tick mark. Note that the grid and chart area extend slightly above the 95.0 mark.
**3. Data Labels (In-line Legend)**
Instead of a traditional legend box, the series are labeled directly on the chart area near their terminal data points.
* **Label 1:** "ARC (AI2 Reasoning Challenge)" - Written in light blue/cyan text, positioned in the top-left quadrant, specifically above and slightly left of the data point at x=3.
* **Label 2:** "DROP" - Written in dark blue text, positioned in the center of the chart, directly above the data point at x=5.
### Detailed Analysis
*Note: All extracted values are approximate (denoted by ~) based on visual interpolation between the y-axis grid lines.*
**Data Series 1: ARC (AI2 Reasoning Challenge)**
* **Visual Attributes:** Light blue/cyan line connecting square markers.
* **Visual Trend:** The line exhibits a steep, consistent upward slope from Model 1 to Model 3.
* **Data Points:**
* **Model 1:** The square marker is positioned just below the 90.0 horizontal grid line. Value: **~89.2%**.
* **Model 2:** The square marker is positioned above the 92.5 line, roughly one-third of the way to the 95.0 line. Value: **~93.3%**.
* **Model 3:** The square marker is positioned above the top labeled axis line (95.0). Value: **~96.4%**.
* *Note:* This data series terminates at Model 3.
**Data Series 2: DROP**
* **Visual Attributes:** Dark blue line connecting circular markers.
* **Visual Trend:** The line shows a slight upward slope from Model 1 to 2, a steeper upward slope to Model 3, a completely flat (horizontal) plateau between Model 3 and 4, and a steep upward slope to Model 5.
* **Data Points:**
* **Model 1:** The circular marker is positioned slightly above the 77.5 line. Value: **~78.4%**.
* **Model 2:** The circular marker is positioned just below the 80.0 line. Value: **~78.9%**.
* **Model 3:** The circular marker is positioned slightly above the 82.5 line. Value: **~83.1%**.
* **Model 4:** The circular marker is positioned at the exact same vertical height as Model 3. Value: **~83.1%**.
* **Model 5:** The circular marker is positioned above the 87.5 line, roughly one-third of the way to 90.0. Value: **~88.3%**.
* *Note:* This data series terminates at Model 5.
### Key Observations
1. **Baseline Discrepancy:** Model 1 performs significantly better on the ARC benchmark (~89.2%) compared to the DROP benchmark (~78.4%).
2. **Missing Data:** The ARC series only contains data for Models 1, 2, and 3. The DROP series contains data for Models 1 through 5. Neither series utilizes the x-axis space for Models 6 through 10.
3. **The Plateau:** The DROP benchmark shows zero improvement between Model 3 and Model 4, which is the only instance of non-growth in the entire chart.
### Interpretation
**What the data suggests:**
This chart illustrates the generational improvement of a specific lineage of AI models (likely Large Language Models, given the benchmarks). "Model Number" implies sequential iterations (e.g., a v1, v2, v3 progression). The data demonstrates that as the model number increases, reasoning and reading comprehension capabilities (as measured by ARC and DROP) generally improve.
**Reading between the lines (Peircean Analysis):**
* **Benchmark Difficulty:** The ARC benchmark (AI2 Reasoning Challenge, typically multiple-choice science questions) appears to be an "easier" task for this specific model architecture, starting near 90% and quickly approaching a ceiling (near 100%). DROP (Discrete Reasoning Over Paragraphs, which requires reading comprehension and discrete operations like addition/sorting) starts much lower, indicating it is a more rigorous test of this model family's capabilities.
* **The Model 3 to 4 Anomaly:** The flatline on the DROP benchmark between Model 3 and Model 4 is highly informative. It suggests that whatever architectural changes, scaling, or training data updates occurred between version 3 and 4, they did *not* benefit the specific complex reasoning skills required by DROP. However, the subsequent leap from Model 4 to Model 5 indicates a major breakthrough or significant scaling event that resolved this bottleneck.
* **Chart Design and Intent:** The x-axis extends to 10, but data stops at 3 and 5. This spatial emptiness on the right side of the chart serves a rhetorical purpose: it implies a roadmap. The creator of this chart is likely showing current progress while leaving room to plot future, unreleased models (Models 6-10), visually communicating an expectation of continued future growth. The fact that ARC stops at Model 3 might indicate that the benchmark was "solved" (approaching 100% accuracy) by Model 3, rendering it useless for testing Models 4 and 5, hence its removal from later evaluations.