## Line Chart: Model Performance on ARC and DROP Datasets
### Overview
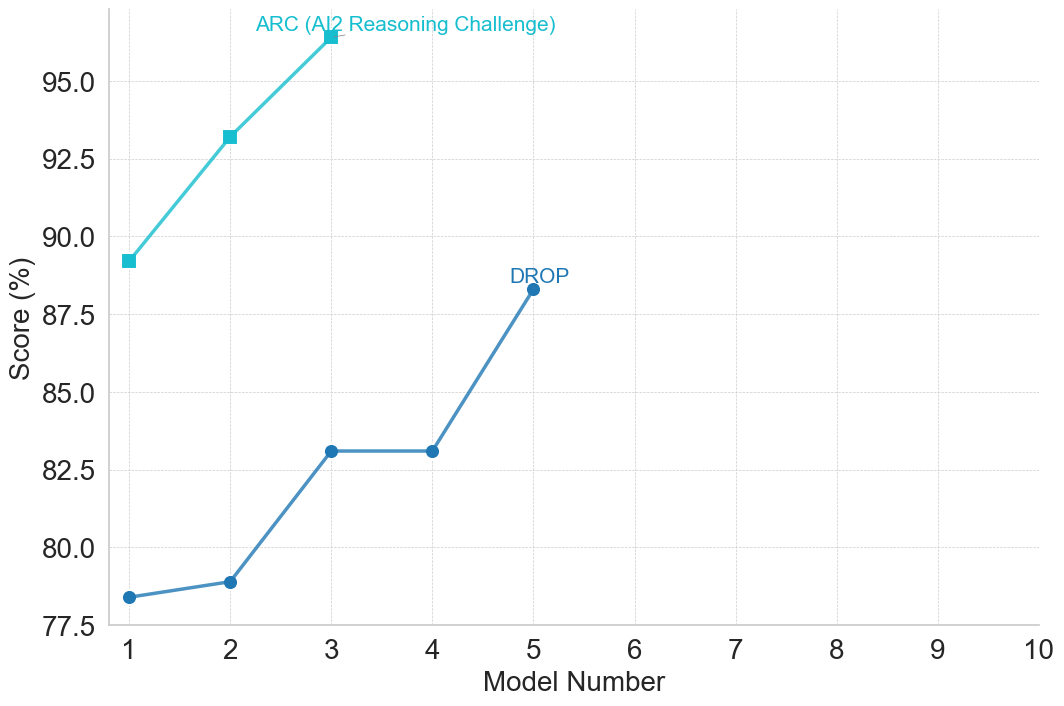
The image is a line chart comparing the performance of different models on two datasets: ARC (AI2 Reasoning Challenge) and DROP. The chart plots the "Score (%)" on the y-axis against the "Model Number" on the x-axis. Two lines represent the performance of models on each dataset.
### Components/Axes
* **X-axis:** "Model Number" ranging from 1 to 10.
* **Y-axis:** "Score (%)" ranging from 77.5 to 95.0, with increments of 2.5.
* **Data Series:**
* **ARC (AI2 Reasoning Challenge):** Light blue line with square markers.
* **DROP:** Blue line with circular markers.
### Detailed Analysis
**ARC (AI2 Reasoning Challenge) - Light Blue Line with Square Markers:**
* **Trend:** The line slopes upward, indicating increasing performance with higher model numbers.
* **Data Points:**
* Model 1: Approximately 89.3%
* Model 2: Approximately 93.1%
* The line continues upward beyond Model 2, but no further data points are explicitly shown.
**DROP - Blue Line with Circular Markers:**
* **Trend:** The line initially increases, plateaus, and then increases again.
* **Data Points:**
* Model 1: Approximately 78.4%
* Model 2: Approximately 78.9%
* Model 3: Approximately 83.1%
* Model 4: Approximately 83.1%
* Model 5: Approximately 88.2%
### Key Observations
* The ARC dataset shows a consistently increasing performance as the model number increases.
* The DROP dataset shows an initial increase in performance, followed by a plateau, and then another increase.
* The ARC dataset has a higher score than the DROP dataset for the models shown.
### Interpretation
The chart suggests that models perform differently on the ARC and DROP datasets. The ARC dataset seems to benefit more from increasing model complexity (represented by the model number), while the DROP dataset shows a more complex performance pattern with periods of improvement and stagnation. The higher scores on the ARC dataset might indicate that the models are better suited for the type of reasoning required by the AI2 Reasoning Challenge compared to the DROP dataset. The plateau in the DROP dataset's performance could indicate a limitation in the models' ability to handle the specific challenges posed by that dataset at certain model complexities.