\n
## Line Chart: Model Performance on Reasoning Challenges
### Overview
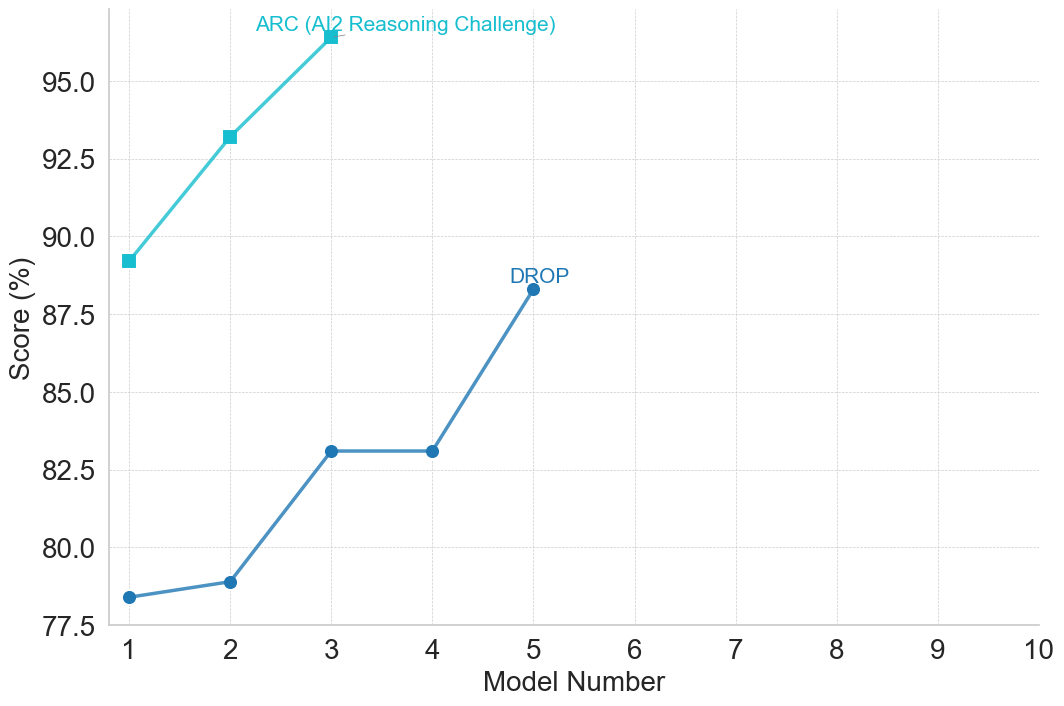
This image presents a line chart illustrating the performance of different models on two reasoning challenges: ARC (AI2 Reasoning Challenge) and DROP. The y-axis represents the score in percentage, while the x-axis represents the model number, ranging from 1 to 10. Two distinct lines depict the performance of the models on each challenge.
### Components/Axes
* **X-axis Title:** "Model Number" (ranging from 1 to 10)
* **Y-axis Title:** "Score (%)" (ranging from 77.5 to 95.0)
* **Line 1 (Teal):** Represents performance on the ARC (AI2 Reasoning Challenge).
* **Line 2 (Blue):** Represents performance on the DROP challenge.
* **Annotation 1:** "ARC (AI2 Reasoning Challenge)" positioned near the peak of the teal line.
* **Annotation 2:** "DROP" positioned near the peak of the blue line.
### Detailed Analysis
**ARC (Teal Line):**
The teal line shows an overall upward trend, initially increasing rapidly, then leveling off.
* Model 1: Approximately 78.0%
* Model 2: Approximately 92.5%
* Model 3: Approximately 95.0%
* Model 4: Approximately 82.5%
* Model 5: Approximately 88.0%
* Models 6-10: The line remains relatively flat at approximately 88.0%
**DROP (Blue Line):**
The blue line shows a more gradual increase, with a significant drop after Model 3.
* Model 1: Approximately 77.5%
* Model 2: Approximately 80.0%
* Model 3: Approximately 82.5%
* Model 4: Approximately 82.5%
* Model 5: Approximately 87.5%
* Models 6-10: The line remains relatively flat at approximately 87.5%
### Key Observations
* The ARC challenge shows higher scores overall compared to the DROP challenge.
* Model 3 achieves the highest score on the ARC challenge.
* Model 5 shows the highest score on the DROP challenge.
* The DROP challenge exhibits a more volatile performance curve, with a noticeable dip after Model 3.
* Both challenges show diminishing returns after a certain model number (around 5).
### Interpretation
The data suggests that model performance on reasoning challenges improves with model number, but this improvement plateaus after a certain point. The ARC challenge appears to be easier for the models to solve, consistently achieving higher scores than the DROP challenge. The drop in performance on the DROP challenge after Model 3 could indicate that the challenge requires different capabilities that are not being effectively scaled with the model number. The leveling off of both lines suggests that further increasing the model number may not lead to significant performance gains, and that other factors, such as model architecture or training data, may be more important for improving performance on these reasoning challenges. The annotations highlight the specific challenges being evaluated, providing context for the performance metrics. The visual representation effectively communicates the relative performance of the models on each challenge and the diminishing returns observed as the model number increases.