# Technical Document Extraction: Line Chart Analysis
## Chart Overview
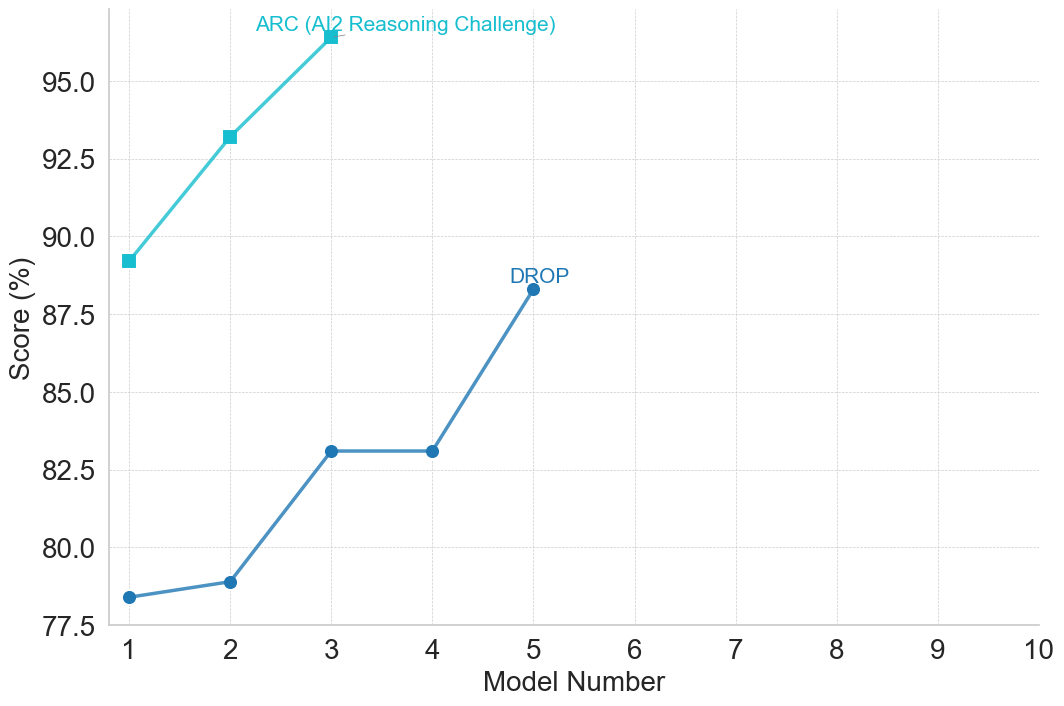
The image depicts a **line chart** comparing performance scores across different model numbers for two datasets: **ARC (AI2 Reasoning Challenge)** and **DROP**. The chart emphasizes trends in scores (%) against model numbers (1–10).
---
### Axis Labels and Scale
- **X-Axis (Horizontal):**
- Label: `Model Number`
- Range: 1 to 10 (integer increments)
- Tick marks: Every 1 unit (1, 2, ..., 10).
- **Y-Axis (Vertical):**
- Label: `Score (%)`
- Range: 77.5% to 95.5% (increments of 2.5%).
- Tick marks: Every 2.5% (77.5, 80.0, ..., 95.5).
---
### Legend
- **Location:** Top-right corner of the chart.
- **Entries:**
1. **ARC (AI2 Reasoning Challenge):** Teal line with square markers.
2. **DROP:** Blue line with circular markers.
---
### Data Series and Trends
#### 1. **ARC (AI2 Reasoning Challenge)**
- **Color:** Teal (#008080).
- **Markers:** Square-shaped.
- **Data Points:**
- Model 1: 89%
- Model 2: 93%
- Model 3: 96%
- **Trend:** Steadily increasing from Model 1 to Model 3.
- **Annotation:** Text "ARC (AI2 Reasoning Challenge)" placed near the peak (Model 3).
#### 2. **DROP**
- **Color:** Blue (#0000FF).
- **Markers:** Circular.
- **Data Points:**
- Model 1: 78%
- Model 2: 79%
- Model 3: 83%
- Model 4: 83%
- Model 5: 88%
- **Trend:**
- Slight increase from Model 1 to Model 3.
- Plateaus at Model 4 (83%).
- Sharp rise to 88% at Model 5.
- **Annotation:** Text "DROP" placed near the peak (Model 5).
---
### Key Observations
1. **ARC** achieves higher scores (89–96%) compared to **DROP** (78–88%) across overlapping models (1–3).
2. **DROP** shows a significant performance drop after Model 5 (no data for Models 6–10).
3. **ARC** demonstrates consistent improvement, while **DROP** exhibits volatility.
---
### Spatial Grounding and Validation
- **Legend Colors:**
- Teal (ARC) matches the teal line and square markers.
- Blue (DROP) matches the blue line and circular markers.
- **Data Point Accuracy:**
- All plotted points align with their respective legend colors.
- No mismatches detected between legend labels and visual elements.
---
### Missing Data
- **Models 6–10:** No data points are plotted for either series beyond Model 5.
---
### Final Notes
The chart highlights **ARC** as the superior performer in early models, while **DROP** shows mixed results with a notable decline post-Model 5. No additional textual or numerical data is present outside the chart elements described.