\n
## Scatter Plots: Category Distribution Across Layers and Heads
### Overview
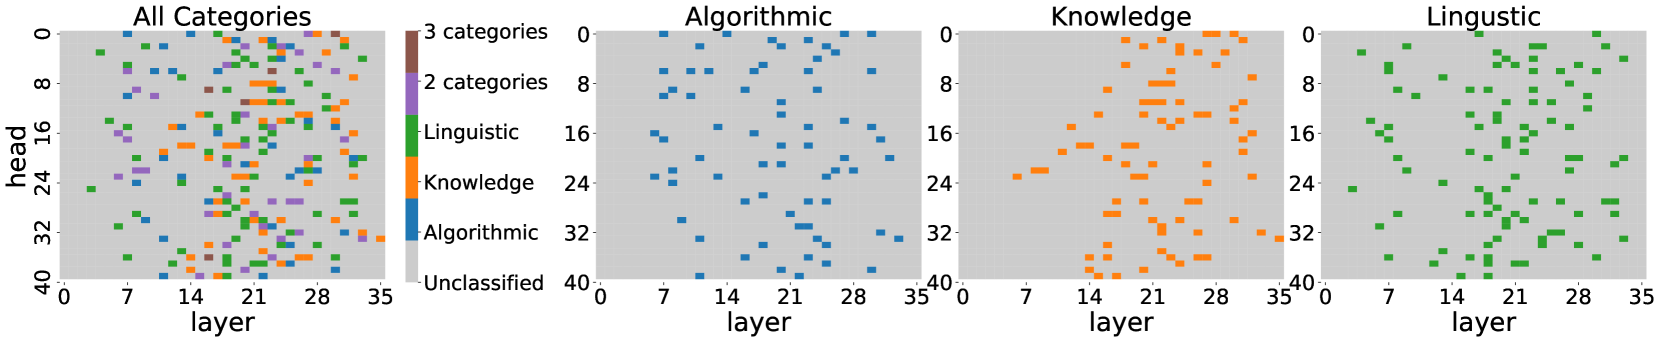
The image presents four scatter plots, each visualizing the distribution of different categories across 'layer' and 'head' dimensions. The first plot shows the distribution of "All Categories", while the subsequent three plots focus on "Algorithmic", "Knowledge", and "Linguistic" categories respectively. Each plot uses a scatter plot to represent the density of data points for each category.
### Components/Axes
Each of the four plots shares the same axes:
* **X-axis:** "layer", ranging from approximately 0 to 35.
* **Y-axis:** "head", ranging from approximately 0 to 40.
* **Categories/Colors:**
* "Unclassified" (Teal/Green)
* "Algorithmic" (Blue)
* "Knowledge" (Orange)
* "Linguistic" (Green)
* The first plot ("All Categories") also indicates the number of categories present in a given region (2 categories, 3 categories).
### Detailed Analysis or Content Details
**1. All Categories Plot:**
* The plot shows a mix of all four categories.
* The teal/green ("Unclassified") category is prevalent in the lower-left region (low layer, low head).
* The blue ("Algorithmic") category is concentrated in the right side (high layer) and middle head values.
* The orange ("Knowledge") category is concentrated in the middle-right region (high layer, middle head).
* The green ("Linguistic") category is concentrated in the left side (low layer) and middle head values.
* The region around layer 28-35 and head 0-8 shows "3 categories" present.
* The region around layer 0-7 and head 16-24 shows "2 categories" present.
**2. Algorithmic Plot:**
* The blue ("Algorithmic") category is the only one present.
* The points are scattered across the layer range (0-35), but are more densely populated between layers 7 and 28.
* The points are scattered across the head range (0-40), with a slight concentration between heads 0 and 16.
**3. Knowledge Plot:**
* The orange ("Knowledge") category is the only one present.
* The points are concentrated in the middle-right region, with layers ranging from approximately 14 to 35 and heads ranging from approximately 8 to 32.
* There is a noticeable gap in the data between layers 0 and 14.
**4. Linguistic Plot:**
* The green ("Linguistic") category is the only one present.
* The points are concentrated in the left side, with layers ranging from approximately 0 to 28 and heads ranging from approximately 8 to 32.
* There is a noticeable gap in the data between layers 28 and 35.
### Key Observations
* The "All Categories" plot demonstrates a clear separation of categories based on layer and head values.
* The "Algorithmic" category appears to be more prevalent in higher layers.
* The "Knowledge" category appears to be more prevalent in middle to higher layers.
* The "Linguistic" category appears to be more prevalent in lower to middle layers.
* The individual category plots show that each category occupies a distinct region of the layer/head space.
### Interpretation
The data suggests that different categories of information are processed at different layers and heads within a neural network or similar system. The "Algorithmic" category is associated with higher layers, potentially indicating that it emerges from more complex processing. The "Knowledge" category also appears in higher layers, suggesting it builds upon the algorithmic processing. The "Linguistic" category is more prominent in lower layers, potentially indicating that it is involved in initial feature extraction. The "Unclassified" category being prevalent in the lower-left suggests that initial processing is often ambiguous or requires further refinement. The separation of these categories across the layer/head space suggests a modular organization of information processing within the system. The gaps in the "Knowledge" and "Linguistic" plots could indicate specific layers or heads that are not involved in processing those types of information.