\n
## Diagram: State Transition Diagram
### Overview
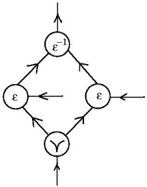
The image depicts a state transition diagram, representing a system with four states: ε (epsilon), ε⁻¹ (epsilon inverse), γ (gamma), and an unspecified initial/final state. Arrows indicate transitions between these states. The diagram is a rhombus shape, with the states positioned at each corner.
### Components/Axes
The diagram consists of four states, labeled as follows:
* Top: ε⁻¹
* Left: ε
* Right: ε
* Bottom: γ
Arrows indicate transitions between states. There are no explicit axes or scales. The diagram shows a cyclical flow between the states.
### Detailed Analysis or Content Details
The diagram shows the following transitions:
* An arrow points *into* the ε⁻¹ state from above.
* An arrow points *from* the ε⁻¹ state to the ε state (left).
* An arrow points *from* the ε state (left) to the γ state (bottom).
* An arrow points *from* the γ state (bottom) to the ε state (right).
* An arrow points *into* the ε state (right) from the right.
* An arrow points *from* the ε state (right) to the ε⁻¹ state (top).
The diagram is a closed loop, indicating a continuous cycle of state transitions. The states are connected in a clockwise manner: ε⁻¹ → ε (left) → γ → ε (right) → ε⁻¹.
### Key Observations
The diagram represents a system with a cyclical state transition. The presence of ε and ε⁻¹ suggests an inverse operation or a reversible process. The γ state represents a distinct state within the cycle. The diagram does not provide any information about the conditions that trigger the transitions.
### Interpretation
This diagram likely represents a mathematical or computational process involving reversible operations. The states could represent different stages in an algorithm, or different values in a variable. The cyclical nature of the diagram suggests that the process repeats indefinitely, or until a specific condition is met. The ε and ε⁻¹ states suggest an operation and its inverse, potentially representing addition and subtraction, or multiplication and division. The γ state could represent a transformation or a different type of operation. Without further context, it is difficult to determine the exact meaning of the diagram. It could be a simplified representation of a more complex system, or a conceptual model of a process. The diagram is a visual representation of a state machine, commonly used in computer science and engineering to model the behavior of systems.