## Line Chart: Cantor Function
### Overview
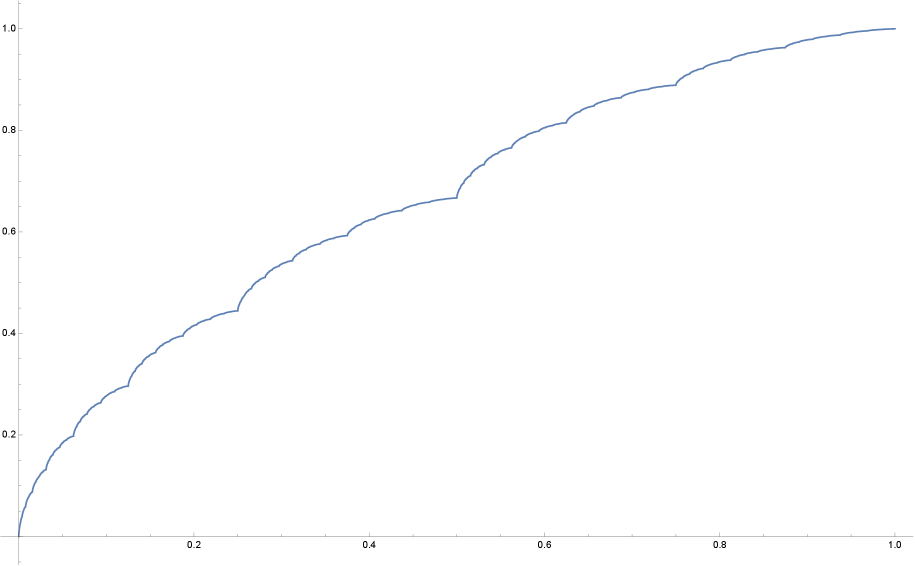
The image is a line chart depicting the Cantor function, also known as the Devil's Staircase. The chart shows a non-decreasing function that increases from 0 to 1, but remains constant on intervals whose total length is 1. The x-axis ranges from 0 to 1, and the y-axis also ranges from 0 to 1. The function is represented by a blue line.
### Components/Axes
* **X-axis:** Ranges from 0 to 1, with markers at 0.2, 0.4, 0.6, 0.8, and 1.0.
* **Y-axis:** Ranges from 0 to 1, with markers at 0.2, 0.4, 0.6, 0.8, and 1.0.
* **Data Series:** A single data series represented by a blue line.
### Detailed Analysis
The blue line representing the Cantor function starts at (0, 0) and ends at (1, 1). The function increases in steps, with horizontal segments in between.
* From x = 0 to approximately x = 0.33, the function increases from 0 to approximately 0.33.
* From x = 0.33 to approximately x = 0.66, the function remains constant at approximately 0.33.
* From x = 0.66 to approximately x = 1, the function increases from approximately 0.33 to 1.
More specifically, the function exhibits a self-similar pattern. It increases from 0 to 1/3, remains constant at 1/3 for a certain interval, then increases from 1/3 to 2/3, remains constant at 2/3 for a certain interval, and finally increases from 2/3 to 1.
### Key Observations
* The function is continuous everywhere but not absolutely continuous.
* The function is constant almost everywhere.
* The function is self-similar.
### Interpretation
The Cantor function is a classic example of a function that is continuous but not absolutely continuous. It demonstrates that a function can increase from 0 to 1 without having a derivative that is positive on a set of positive measure. The function is also an example of a fractal, as it exhibits self-similarity at different scales. The "flat" sections of the curve represent intervals where the function's derivative is zero, contributing to its peculiar properties.