\n
## Chart: Cumulative Distribution Function (CDF)
### Overview
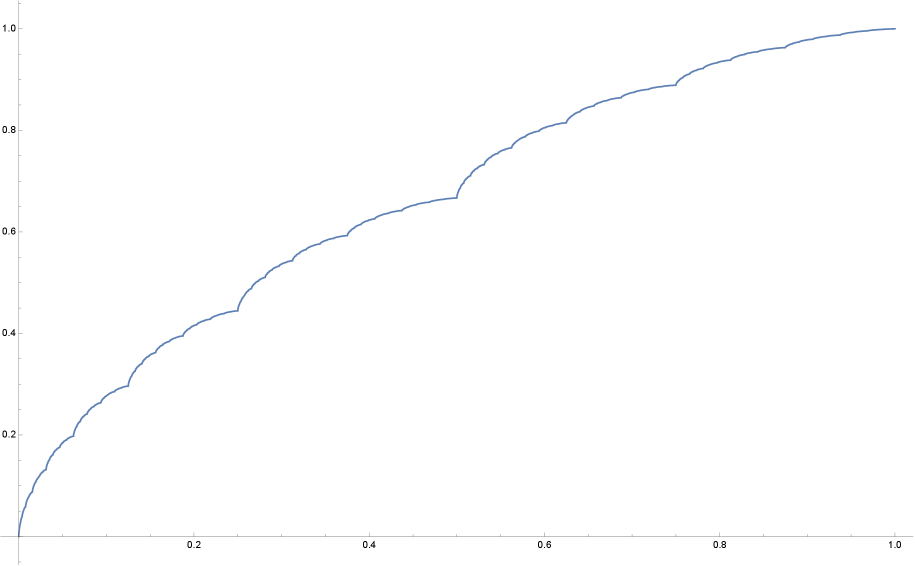
The image displays a cumulative distribution function (CDF) plot. The plot shows the probability that a random variable takes a value less than or equal to a given value. The x and y axes range from 0 to 1. There is a single, blue line representing the CDF.
### Components/Axes
* **X-axis:** Ranges from approximately 0.0 to 1.0. No explicit label is present, but it likely represents the values of the random variable.
* **Y-axis:** Ranges from approximately 0.0 to 1.0. No explicit label is present, but it likely represents the cumulative probability.
* **Data Series:** A single blue line representing the CDF.
* **Legend:** No legend is present.
### Detailed Analysis
The blue line starts at approximately (0.0, 0.05) and increases monotonically towards (1.0, 0.98).
Here's an approximate reconstruction of data points, noting the difficulty in precise reading:
* (0.05, 0.1)
* (0.1, 0.2)
* (0.2, 0.3)
* (0.3, 0.4)
* (0.4, 0.5)
* (0.5, 0.65)
* (0.6, 0.8)
* (0.7, 0.85)
* (0.8, 0.9)
* (0.9, 0.95)
* (1.0, 0.98)
The line exhibits a relatively steep slope in the initial segment (x = 0.0 to 0.5), indicating a higher density of values in that range. There is a noticeable flattening of the curve between x = 0.5 and x = 0.7, suggesting a lower density of values in that range. The curve approaches 1.0 asymptotically as x approaches 1.0.
### Key Observations
* The CDF is monotonically increasing, as expected.
* The CDF does not reach 1.0 exactly at x = 1.0, suggesting the possibility of a discrete distribution or a data limitation.
* The curve shows a change in slope around x = 0.5, indicating a shift in the distribution's density.
### Interpretation
The CDF plot suggests that the random variable is not uniformly distributed. The initial steep slope indicates that a significant portion of the values are concentrated in the lower range (0.0 to 0.5). The flattening of the curve in the higher range suggests that values are less frequent as they approach 1.0. The fact that the CDF doesn't reach 1.0 at x=1.0 could indicate that there is a non-zero probability of values exceeding 1.0, or that the data is truncated. Without further information about the underlying data or the context of the plot, it is difficult to draw more specific conclusions. The plot is a visual representation of the probability distribution of the variable, and can be used to understand the likelihood of observing different values.