## Line Graph: Unlabeled Monotonic Increase
### Overview
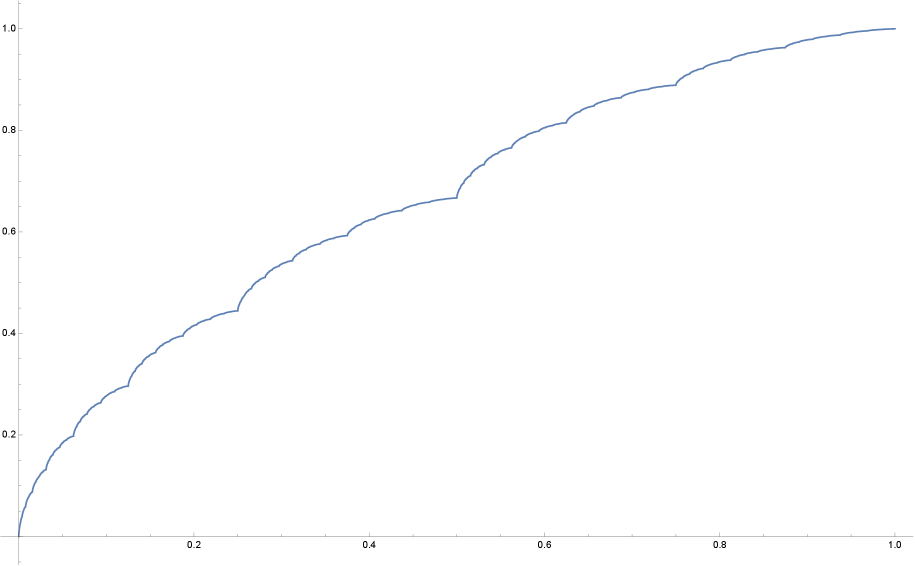
The image depicts a simple line graph with a single blue line that starts at the origin (0,0) and increases steadily to the right, reaching a value of approximately 1.0 on the y-axis at the far right of the x-axis (1.0). The graph lacks axis labels, legends, or data point annotations, making it ambiguous in terms of context or units.
### Components/Axes
- **X-Axis**: Unlabeled, spans from 0.0 to 1.0 in increments of 0.2. Ticks are marked at 0.0, 0.2, 0.4, 0.6, 0.8, and 1.0.
- **Y-Axis**: Unlabeled, spans from 0.0 to 1.0 in increments of 0.2. Ticks are marked at 0.0, 0.2, 0.4, 0.6, 0.8, and 1.0.
- **Legend**: Absent. No color-key or labels are present to identify the data series.
- **Line**: A single blue line with no markers, annotations, or breaks. The line is smooth and monotonically increasing.
### Detailed Analysis
- **Trend**: The line exhibits a consistent upward slope from left to right, with no plateaus or declines. The rate of increase appears to accelerate slightly in the middle range (x ≈ 0.4 to 0.6) before stabilizing near the end.
- **Data Points**: No explicit data points are labeled or marked. The line passes through the origin (0,0) and terminates near (1.0, 1.0), though the exact endpoint is not clearly defined due to the lack of gridlines or markers.
- **Scale**: Both axes use a linear scale with equal spacing between ticks. The absence of units or labels prevents interpretation of the variables represented.
### Key Observations
1. **Monotonic Increase**: The line strictly increases without any decreases or oscillations.
2. **Asymptotic Behavior**: The line approaches a value of 1.0 on the y-axis as x approaches 1.0, suggesting a potential asymptotic relationship.
3. **Missing Context**: The absence of axis labels, legends, or units renders the graph non-informative for technical analysis.
### Interpretation
The graph likely represents a generic example of a monotonic function or cumulative distribution, but its lack of labels and context limits its utility. The steady increase could imply a cumulative process (e.g., probability, efficiency, or growth), but without explicit definitions for the x- and y-axes, this remains speculative. The smoothness of the line suggests a continuous, deterministic relationship rather than a stochastic or noisy dataset. For technical documentation, this graph would require additional annotations to convey meaningful insights.