\n
## Image: Novel View Synthesis Comparison
### Overview
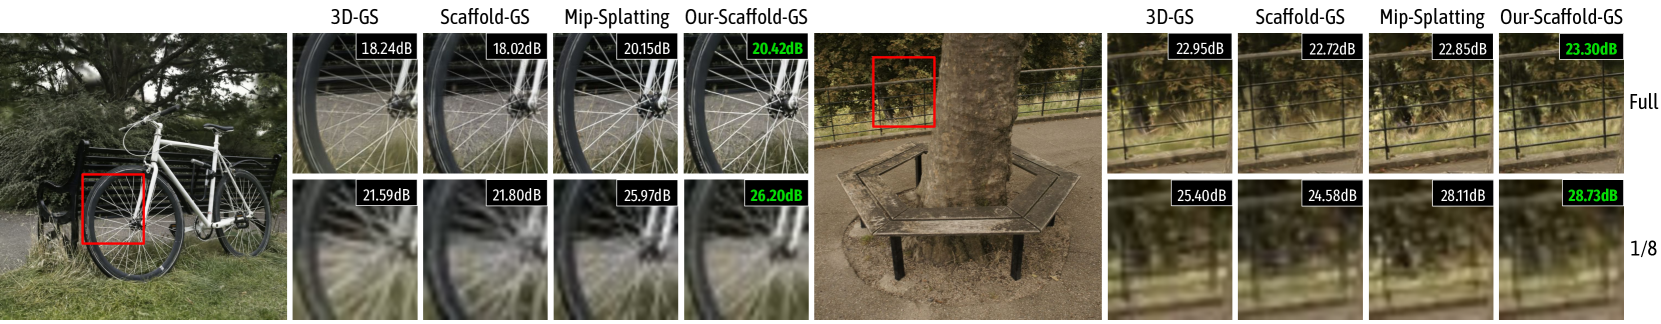
The image presents a comparative visual analysis of novel view synthesis techniques applied to a scene containing a bicycle and a tree. Four different methods – 3D-GS, Scaffold-GS, MIP-Splatting, and Our-Scaffold-GS – are evaluated, with quantitative metrics (dB values) displayed alongside each rendered image. The scene is shown from multiple viewpoints, indicated by "Full" and "1/8" labels. A red bounding box is consistently present in each image, highlighting a specific region of interest (the bicycle wheel or tree trunk).
### Components/Axes
The image is organized into columns, each representing a different synthesis method. Each column contains two rows, showing different viewpoints of the scene. The top row shows a "Full" view, while the bottom row shows a "1/8" view. Each image is accompanied by a dB value, presumably representing a quality metric (lower dB generally indicates better quality). The methods are labeled at the top of each column.
### Detailed Analysis or Content Details
The image contains 8 rendered images, each with associated dB values. Here's a breakdown:
**Left Side (Bicycle Focus):**
* **3D-GS (Full):** dB = 18.24dB
* **Scaffold-GS (Full):** dB = 18.00dB
* **Mip-Splatting (Full):** dB = 20.15dB
* **Our-Scaffold-GS (Full):** dB = 20.42dB
* **3D-GS (1/8):** dB = 21.59dB
* **Scaffold-GS (1/8):** dB = 21.80dB
* **Mip-Splatting (1/8):** dB = 25.97dB
* **Our-Scaffold-GS (1/8):** dB = 26.20dB
**Right Side (Tree Focus):**
* **3D-GS (Full):** dB = 22.95dB
* **Scaffold-GS (Full):** dB = 22.72dB
* **Mip-Splatting (Full):** dB = 22.85dB
* **Our-Scaffold-GS (Full):** dB = 23.30dB
* **3D-GS (1/8):** dB = 25.40dB
* **Scaffold-GS (1/8):** dB = 24.58dB
* **Mip-Splatting (1/8):** dB = 28.11dB
* **Our-Scaffold-GS (1/8):** dB = 28.73dB
The red bounding box consistently highlights the bicycle wheel in the left images and the tree trunk in the right images.
### Key Observations
* **dB Values:** Generally, lower dB values indicate better reconstruction quality.
* **Viewpoint Impact:** dB values consistently increase when switching from the "Full" view to the "1/8" view for all methods, suggesting that reconstruction quality degrades with more extreme viewpoints.
* **Method Comparison:** "Our-Scaffold-GS" consistently has the highest dB values (worst quality) in the "Full" view, but is competitive in the "1/8" view. "3D-GS" and "Scaffold-GS" generally have the lowest dB values (best quality) in the "Full" view. "Mip-Splatting" performs intermediately.
* **Mip-Splatting Degradation:** Mip-Splatting shows the largest increase in dB value when moving from the "Full" to the "1/8" view, indicating a significant quality drop with viewpoint change.
### Interpretation
This image presents a comparative evaluation of four novel view synthesis techniques. The dB metric is used to quantify the quality of the synthesized images, with lower values indicating better results. The consistent presence of the red bounding box suggests that the researchers are specifically evaluating the reconstruction quality of these methods in the highlighted regions (bicycle wheel and tree trunk).
The data suggests that "3D-GS" and "Scaffold-GS" perform best in the "Full" view, while "Mip-Splatting" struggles with viewpoint changes. "Our-Scaffold-GS" appears to be less effective in the "Full" view but maintains competitive performance in the "1/8" view. This could indicate that "Our-Scaffold-GS" is more robust to extreme viewpoints, but sacrifices quality in more common views.
The increasing dB values with the "1/8" view across all methods highlight the inherent difficulty of novel view synthesis at extreme viewpoints. This is likely due to a lack of sufficient information for accurate reconstruction. The comparison provides valuable insights into the strengths and weaknesses of each method, guiding future research in novel view synthesis. The choice of method would depend on the application and the expected range of viewpoints.