\n
## Line Charts: Importance vs. Heads for Different Tasks
### Overview
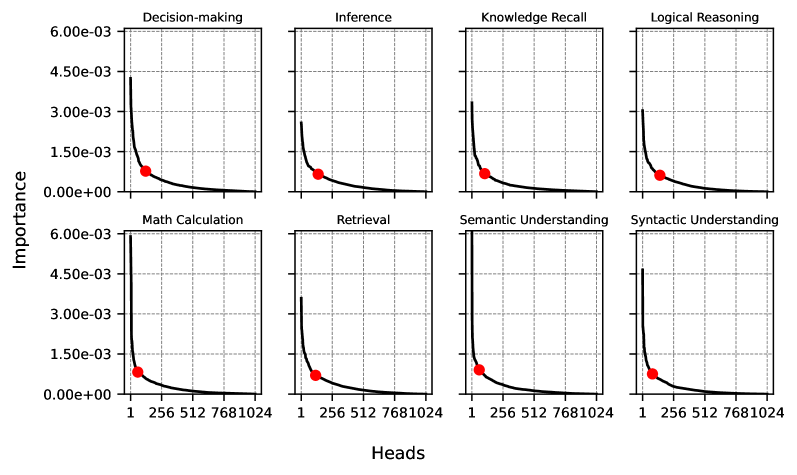
The image presents a 2x4 grid of line charts. Each chart depicts the relationship between "Importance" (y-axis) and "Heads" (x-axis) for a different cognitive task: Decision-making, Inference, Knowledge Recall, Logical Reasoning, Math Calculation, Retrieval, Semantic Understanding, and Syntactic Understanding. All charts share the same axes scales. The lines represent the trend of importance as the number of heads increases.
### Components/Axes
* **X-axis:** "Heads" with markers at 1, 256, 512, 768, and 1024.
* **Y-axis:** "Importance" ranging from 0.00e+00 to 6.00e-03.
* **Chart Titles:** Each chart is labeled with the specific task it represents.
* **Data Series:** Each chart contains a single line representing the importance trend. All lines are red.
### Detailed Analysis or Content Details
Each chart shows a steep decline in importance as the number of heads increases from 1 to 256, followed by a more gradual decline as the number of heads increases further to 1024.
**1. Decision-making:**
* Trend: The line starts at approximately 1.6e-03 and rapidly decreases to near 0.00e+00 between 1 and 256 heads. It remains relatively flat from 256 to 1024.
* Data Points (approximate):
* 1 Head: 1.6e-03
* 256 Heads: 1.0e-04
* 512 Heads: 8.0e-05
* 768 Heads: 7.0e-05
* 1024 Heads: 6.0e-05
**2. Inference:**
* Trend: Similar to Decision-making, a sharp decline from 1 to 256 heads, followed by a leveling off.
* Data Points (approximate):
* 1 Head: 5.0e-03
* 256 Heads: 2.0e-04
* 512 Heads: 1.5e-04
* 768 Heads: 1.3e-04
* 1024 Heads: 1.2e-04
**3. Knowledge Recall:**
* Trend: A steep initial drop, then a flattening.
* Data Points (approximate):
* 1 Head: 4.5e-03
* 256 Heads: 1.5e-04
* 512 Heads: 1.0e-04
* 768 Heads: 9.0e-05
* 1024 Heads: 8.0e-05
**4. Logical Reasoning:**
* Trend: Similar pattern to the others.
* Data Points (approximate):
* 1 Head: 3.0e-03
* 256 Heads: 8.0e-05
* 512 Heads: 6.0e-05
* 768 Heads: 5.0e-05
* 1024 Heads: 4.0e-05
**5. Math Calculation:**
* Trend: Sharp decline, then leveling.
* Data Points (approximate):
* 1 Head: 1.6e-03
* 256 Heads: 1.0e-04
* 512 Heads: 8.0e-05
* 768 Heads: 7.0e-05
* 1024 Heads: 6.0e-05
**6. Retrieval:**
* Trend: Very steep initial drop, then a plateau.
* Data Points (approximate):
* 1 Head: 5.0e-03
* 256 Heads: 2.0e-04
* 512 Heads: 1.5e-04
* 768 Heads: 1.3e-04
* 1024 Heads: 1.2e-04
**7. Semantic Understanding:**
* Trend: Similar to Knowledge Recall.
* Data Points (approximate):
* 1 Head: 4.5e-03
* 256 Heads: 1.5e-04
* 512 Heads: 1.0e-04
* 768 Heads: 9.0e-05
* 1024 Heads: 8.0e-05
**8. Syntactic Understanding:**
* Trend: Similar to Logical Reasoning.
* Data Points (approximate):
* 1 Head: 3.0e-03
* 256 Heads: 8.0e-05
* 512 Heads: 6.0e-05
* 768 Heads: 5.0e-05
* 1024 Heads: 4.0e-05
### Key Observations
* All tasks exhibit a significant decrease in importance as the number of heads increases.
* The most substantial drop in importance occurs between 1 and 256 heads.
* Beyond 256 heads, the importance levels off for all tasks, indicating diminishing returns.
* Inference and Retrieval show the highest initial importance values.
* Logical Reasoning and Syntactic Understanding show the lowest initial importance values.
### Interpretation
The data suggests that increasing the number of "heads" (likely referring to model parameters or attention heads in a neural network) initially provides substantial benefits in terms of importance for all cognitive tasks. However, there is a point of diminishing returns, around 256 heads, where adding more heads yields progressively smaller improvements. This implies an optimal range for model size or complexity for these tasks. The differences in initial importance values between tasks suggest that some tasks inherently benefit more from increased model capacity than others. The rapid decline in importance with increasing heads could be related to overfitting or the introduction of redundant parameters. The consistent pattern across all tasks suggests a fundamental principle governing the relationship between model capacity and performance in these cognitive domains.