## Line Charts: Importance of Attention Heads Across Cognitive Tasks
### Overview
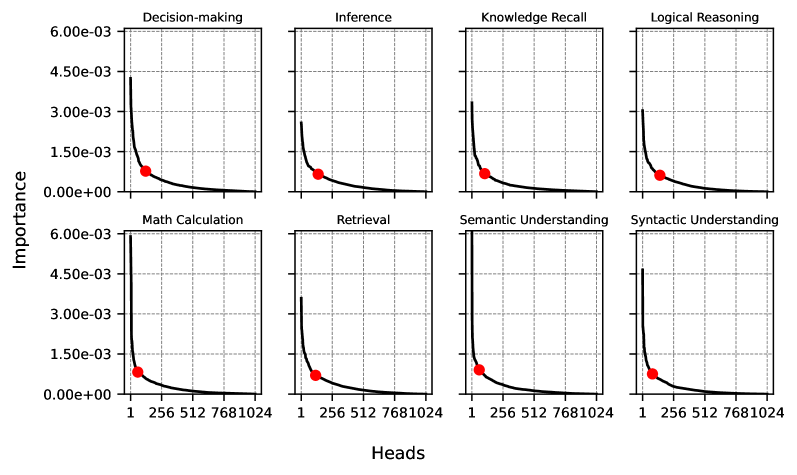
The image displays a 2x4 grid of eight line charts, each illustrating the relationship between the number of attention "Heads" (x-axis) and their "Importance" (y-axis) for a specific cognitive task. All charts share identical axes scales and a consistent visual pattern: a steeply decaying curve. A single red dot is plotted on each curve, marking a specific point of interest.
### Components/Axes
* **Chart Titles (Top of each subplot):** Decision-making, Inference, Knowledge Recall, Logical Reasoning, Math Calculation, Retrieval, Semantic Understanding, Syntactic Understanding.
* **Y-Axis Label (Left side, shared):** "Importance"
* **Y-Axis Scale (Left side, shared):** Linear scale from `0.00e+00` to `6.00e-03`, with major ticks at `1.50e-03`, `3.00e-03`, `4.50e-03`, and `6.00e-03`.
* **X-Axis Label (Bottom center, shared):** "Heads"
* **X-Axis Scale (Bottom of each subplot):** Non-linear scale with labeled ticks at `1`, `256`, `512`, `768`, and `1024`.
* **Data Series:** A single black line in each chart.
* **Marker:** A solid red circle (dot) on each line.
### Detailed Analysis
Each chart follows the same fundamental trend: a rapid, near-exponential decay in "Importance" as the number of "Heads" increases from 1. The curve flattens significantly after approximately 256 heads, showing diminishing returns.
**Spatial Grounding & Trend Verification:**
The red dot is consistently placed at the x-axis value of **256** in all eight charts. Its vertical position (y-value) varies, indicating the importance score at that specific point for each task.
**Task-Specific Data Points (Approximate):**
* **Decision-making:** Curve starts near `4.50e-03` at 1 head. Red dot at 256 heads is at ~`1.00e-03`.
* **Inference:** Curve starts near `3.00e-03`. Red dot at 256 heads is at ~`0.75e-03`.
* **Knowledge Recall:** Curve starts near `3.00e-03`. Red dot at 256 heads is at ~`0.75e-03`.
* **Logical Reasoning:** Curve starts near `3.00e-03`. Red dot at 256 heads is at ~`0.75e-03`.
* **Math Calculation:** Curve starts highest, near `6.00e-03`. Red dot at 256 heads is at ~`1.00e-03`.
* **Retrieval:** Curve starts near `3.00e-03`. Red dot at 256 heads is at ~`0.75e-03`.
* **Semantic Understanding:** Curve starts near `6.00e-03`. Red dot at 256 heads is at ~`1.00e-03`.
* **Syntactic Understanding:** Curve starts near `4.50e-03`. Red dot at 256 heads is at ~`1.00e-03`.
### Key Observations
1. **Universal Decay Pattern:** All eight cognitive tasks exhibit the same sharp decline in head importance, suggesting a common underlying principle in the model's architecture or training.
2. **Initial Importance Varies:** The starting importance (at 1 head) differs by task. "Math Calculation" and "Semantic Understanding" begin at the highest level (`~6.00e-03`), while "Inference," "Knowledge Recall," "Logical Reasoning," and "Retrieval" begin at a lower level (`~3.00e-03`).
3. **Convergence Point:** The red dot at 256 heads serves as a visual benchmark. For tasks with higher initial importance (Math, Semantic, Decision, Syntactic), the importance at 256 heads is approximately `1.00e-03`. For tasks with lower initial importance, it is approximately `0.75e-03`.
4. **Plateau:** Beyond 256 heads, the curve becomes very flat, indicating that heads numbered 512, 768, and 1024 contribute negligible additional importance.
### Interpretation
This visualization likely analyzes the contribution of individual attention heads in a large language model (with up to 1024 heads) to various cognitive capabilities. The data suggests a **"sparse importance"** or **"lottery ticket"** hypothesis within the model's attention mechanism.
* **What it demonstrates:** A very small subset of attention heads (likely the first few dozen or hundred) carry the vast majority of the functional importance for performing these tasks. The remaining hundreds of heads contribute minimally.
* **Relationship between elements:** The consistent decay across diverse tasks implies this is a structural property of the model, not task-specific. The red dot at 256 heads may represent a design choice, a pruning threshold, or a point of analysis in the source study.
* **Notable implications:** This pattern has significant implications for model efficiency and interpretability. It suggests that model compression techniques (like pruning) could potentially remove a large percentage of attention heads (e.g., those beyond the 256 mark) with minimal impact on performance across these core cognitive tasks. It also indicates that understanding model behavior may be tractable by focusing on this smaller, high-importance subset of components. The variation in starting importance hints that some tasks (like math and semantic understanding) may rely on a more concentrated or potent set of initial heads compared to others.