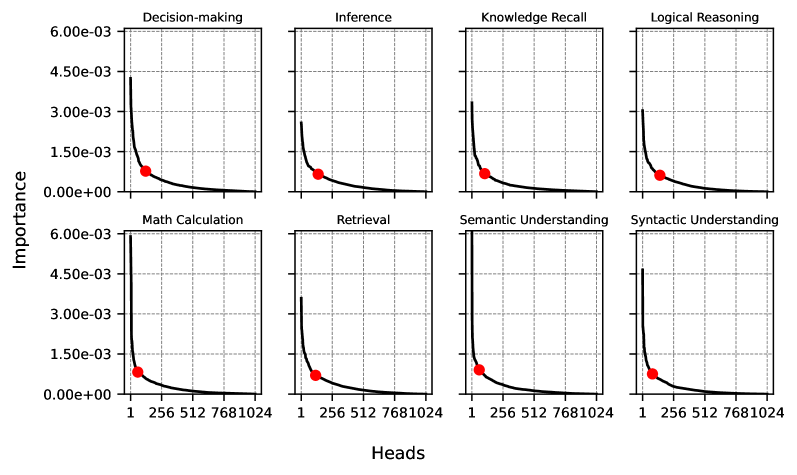
## Line Graphs: Cognitive Process Importance Across Heads
### Overview
The image displays eight line graphs arranged in a 2x4 grid, each representing a cognitive process (e.g., Decision-making, Inference, Knowledge Recall). All graphs share identical axes:
- **X-axis**: "Heads" (logarithmic scale: 1, 256, 512, 7681024)
- **Y-axis**: "Importance" (linear scale: 0.00e+00 to 6.00e-03)
Each graph features a black line and a single red data point at the first x-axis value (1 head). The lines exhibit a sharp decline in importance after the initial head, with values approaching zero for subsequent heads.
---
### Components/Axes
1. **X-axis (Heads)**:
- Values: 1, 256, 512, 7681024 (logarithmic spacing).
- Position: Bottom of all graphs.
2. **Y-axis (Importance)**:
- Values: 0.00e+00 to 6.00e-03 (linear scale).
- Position: Left of all graphs.
3. **Graph Titles**:
- Top row: Decision-making, Inference, Knowledge Recall, Logical Reasoning.
- Bottom row: Math Calculation, Retrieval, Semantic Understanding, Syntactic Understanding.
4. **Data Points**:
- Red dots at (1, ~1.5e-3 to 4.5e-3) for all graphs.
- Black lines drop sharply after x=1, flattening near y=0.
---
### Detailed Analysis
1. **Trends**:
- All graphs show a **steep decline** in importance after the first head.
- Importance at x=1 ranges from **1.5e-3 to 4.5e-3** (red dots).
- For x > 1, importance values are **effectively zero** (black lines collapse to the baseline).
2. **Data Points**:
- Red dots are consistently positioned at the far left (x=1) across all graphs.
- No additional markers or annotations are present.
3. **Scale Observations**:
- The logarithmic x-axis emphasizes the vast difference between 1 and 7681024 heads.
- Y-axis values are uniformly small, suggesting importance is inherently low except at the first head.
---
### Key Observations
1. **Dominance of Initial Heads**:
- Importance is **orders of magnitude higher** at the first head (1) compared to all subsequent heads.
- Example: At x=256, importance drops to ~0.000001 (1e-6), a 1000x reduction from x=1.
2. **Consistency Across Processes**:
- All cognitive processes exhibit identical patterns, indicating a universal trend.
3. **Logarithmic Scale Impact**:
- The x-axis compression visually exaggerates the drop-off, emphasizing the insignificance of additional heads.
---
### Interpretation
The data suggests that cognitive processes (e.g., decision-making, semantic understanding) are **highly sensitive to initial inputs** (first head) but **insensitive to incremental information** (additional heads). This could imply:
- **Primacy Effect**: Early information dominates cognitive outcomes.
- **Diminishing Returns**: Adding more data beyond the first head provides negligible value.
- **Potential Bottlenecks**: Systems relying on these processes may prioritize initial inputs over comprehensive data.
The logarithmic x-axis underscores the scale disparity, reinforcing that even small increases in heads (e.g., 1 → 256) lead to catastrophic drops in importance. This pattern may reflect computational efficiency strategies or cognitive heuristics favoring simplicity over complexity.