## Scatter Plot: Music Genre Distribution in Valid and Test Sets
### Overview
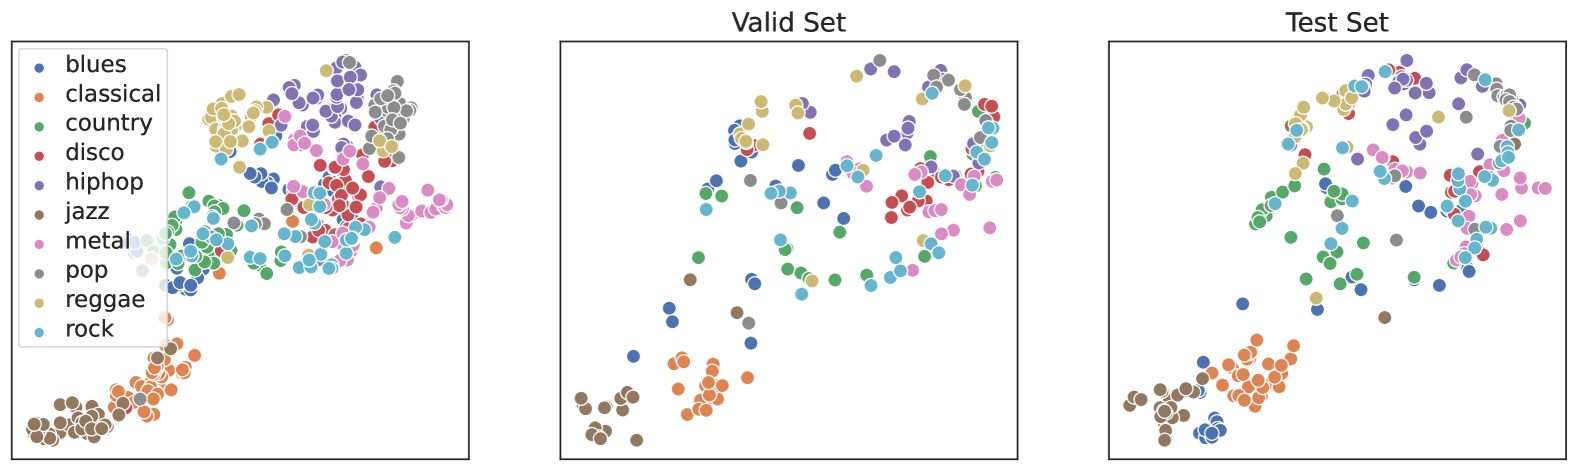
The image displays three panels: a legend on the left and two scatter plots labeled "Valid Set" (middle) and "Test Set" (right). Each plot uses colored dots to represent 10 music genres, with positions indicating genre relationships. The legend maps colors to genres (e.g., blue = blues, orange = classical). No numerical axes are labeled, but spatial distributions suggest dimensionality reduction (e.g., t-SNE/PCA).
### Components/Axes
- **Legend**: Positioned in the top-left corner of the entire image. Contains 10 genre labels with corresponding colors:
- blues (blue), classical (orange), country (green), disco (red), hip-hop (purple), jazz (brown), metal (pink), pop (gray), reggae (yellow), rock (cyan).
- **Valid Set Panel**: Centered middle panel. Titled "Valid Set" at the top.
- **Test Set Panel**: Centered right panel. Titled "Test Set" at the top.
- **Axes**: No explicit numerical labels. X and Y axes appear to represent latent dimensions from dimensionality reduction.
### Detailed Analysis
#### Valid Set
- **Blues (blue)**: Clustered tightly in the bottom-left quadrant.
- **Classical (orange)**: Dense cluster in the bottom-middle, slightly overlapping blues.
- **Country (green)**: Scattered mid-left, forming a loose arc.
- **Disco (red)**: Small cluster near the top-center.
- **Hip-hop (purple)**: Concentrated in the top-right quadrant.
- **Jazz (brown)**: Scattered mid-left, overlapping with blues/classical.
- **Metal (pink)**: Clustered near the top-center, overlapping disco.
- **Pop (gray)**: Dispersed across the top-right, intermingling with hip-hop.
- **Reggae (yellow)**: Small cluster in the mid-right.
- **Rock (cyan)**: Scattered mid-right, overlapping reggae.
#### Test Set
- **Blues (blue)**: More dispersed than Valid Set, extending toward the mid-left.
- **Classical (orange)**: Spread out in the bottom-middle, less dense than Valid Set.
- **Country (green)**: Similar mid-left distribution but slightly more fragmented.
- **Disco (red)**: Smaller cluster near the top-center, less distinct.
- **Hip-hop (purple)**: Top-right cluster remains prominent but slightly smaller.
- **Jazz (brown)**: More spread out, overlapping with blues/classical.
- **Metal (pink)**: Clustered near the top-center, similar to Valid Set.
- **Pop (gray)**: Dispersed across the top-right, similar to Valid Set.
- **Reggae (yellow)**: Small cluster in the mid-right, similar to Valid Set.
- **Rock (cyan)**: More fragmented mid-right distribution.
### Key Observations
1. **Cluster Tightness**: Valid Set genres form tighter clusters than Test Set, suggesting better separation in the training data.
2. **Overlap Patterns**:
- Blues and jazz overlap in both sets, indicating shared features.
- Hip-hop and pop intermingle in the top-right quadrant across both sets.
3. **Test Set Dispersion**: Most genres in the Test Set show broader spatial distribution, implying potential generalization challenges.
4. **Color Consistency**: All colors in the panels match the legend exactly (e.g., blues = blue in both panels).
### Interpretation
The visualization likely represents genre embeddings from a machine learning model. The Valid Set's tighter clusters suggest the model learned distinct genre boundaries during training. The Test Set's dispersed points may indicate:
- Overgeneralization: The model struggles to maintain genre separation on unseen data.
- Data drift: Test Set contains more ambiguous or hybrid genre examples.
- Dimensionality reduction artifacts: The 2D projection may lose critical separability information.
The legend's placement allows direct cross-referencing of colors to genres, ensuring accurate interpretation. No numerical values are provided, but spatial relationships imply hierarchical clustering tendencies (e.g., classical/orange consistently in bottom regions, hip-hop/purple in top-right).