## Chart Type: Decision Boundary Heatmaps
### Overview
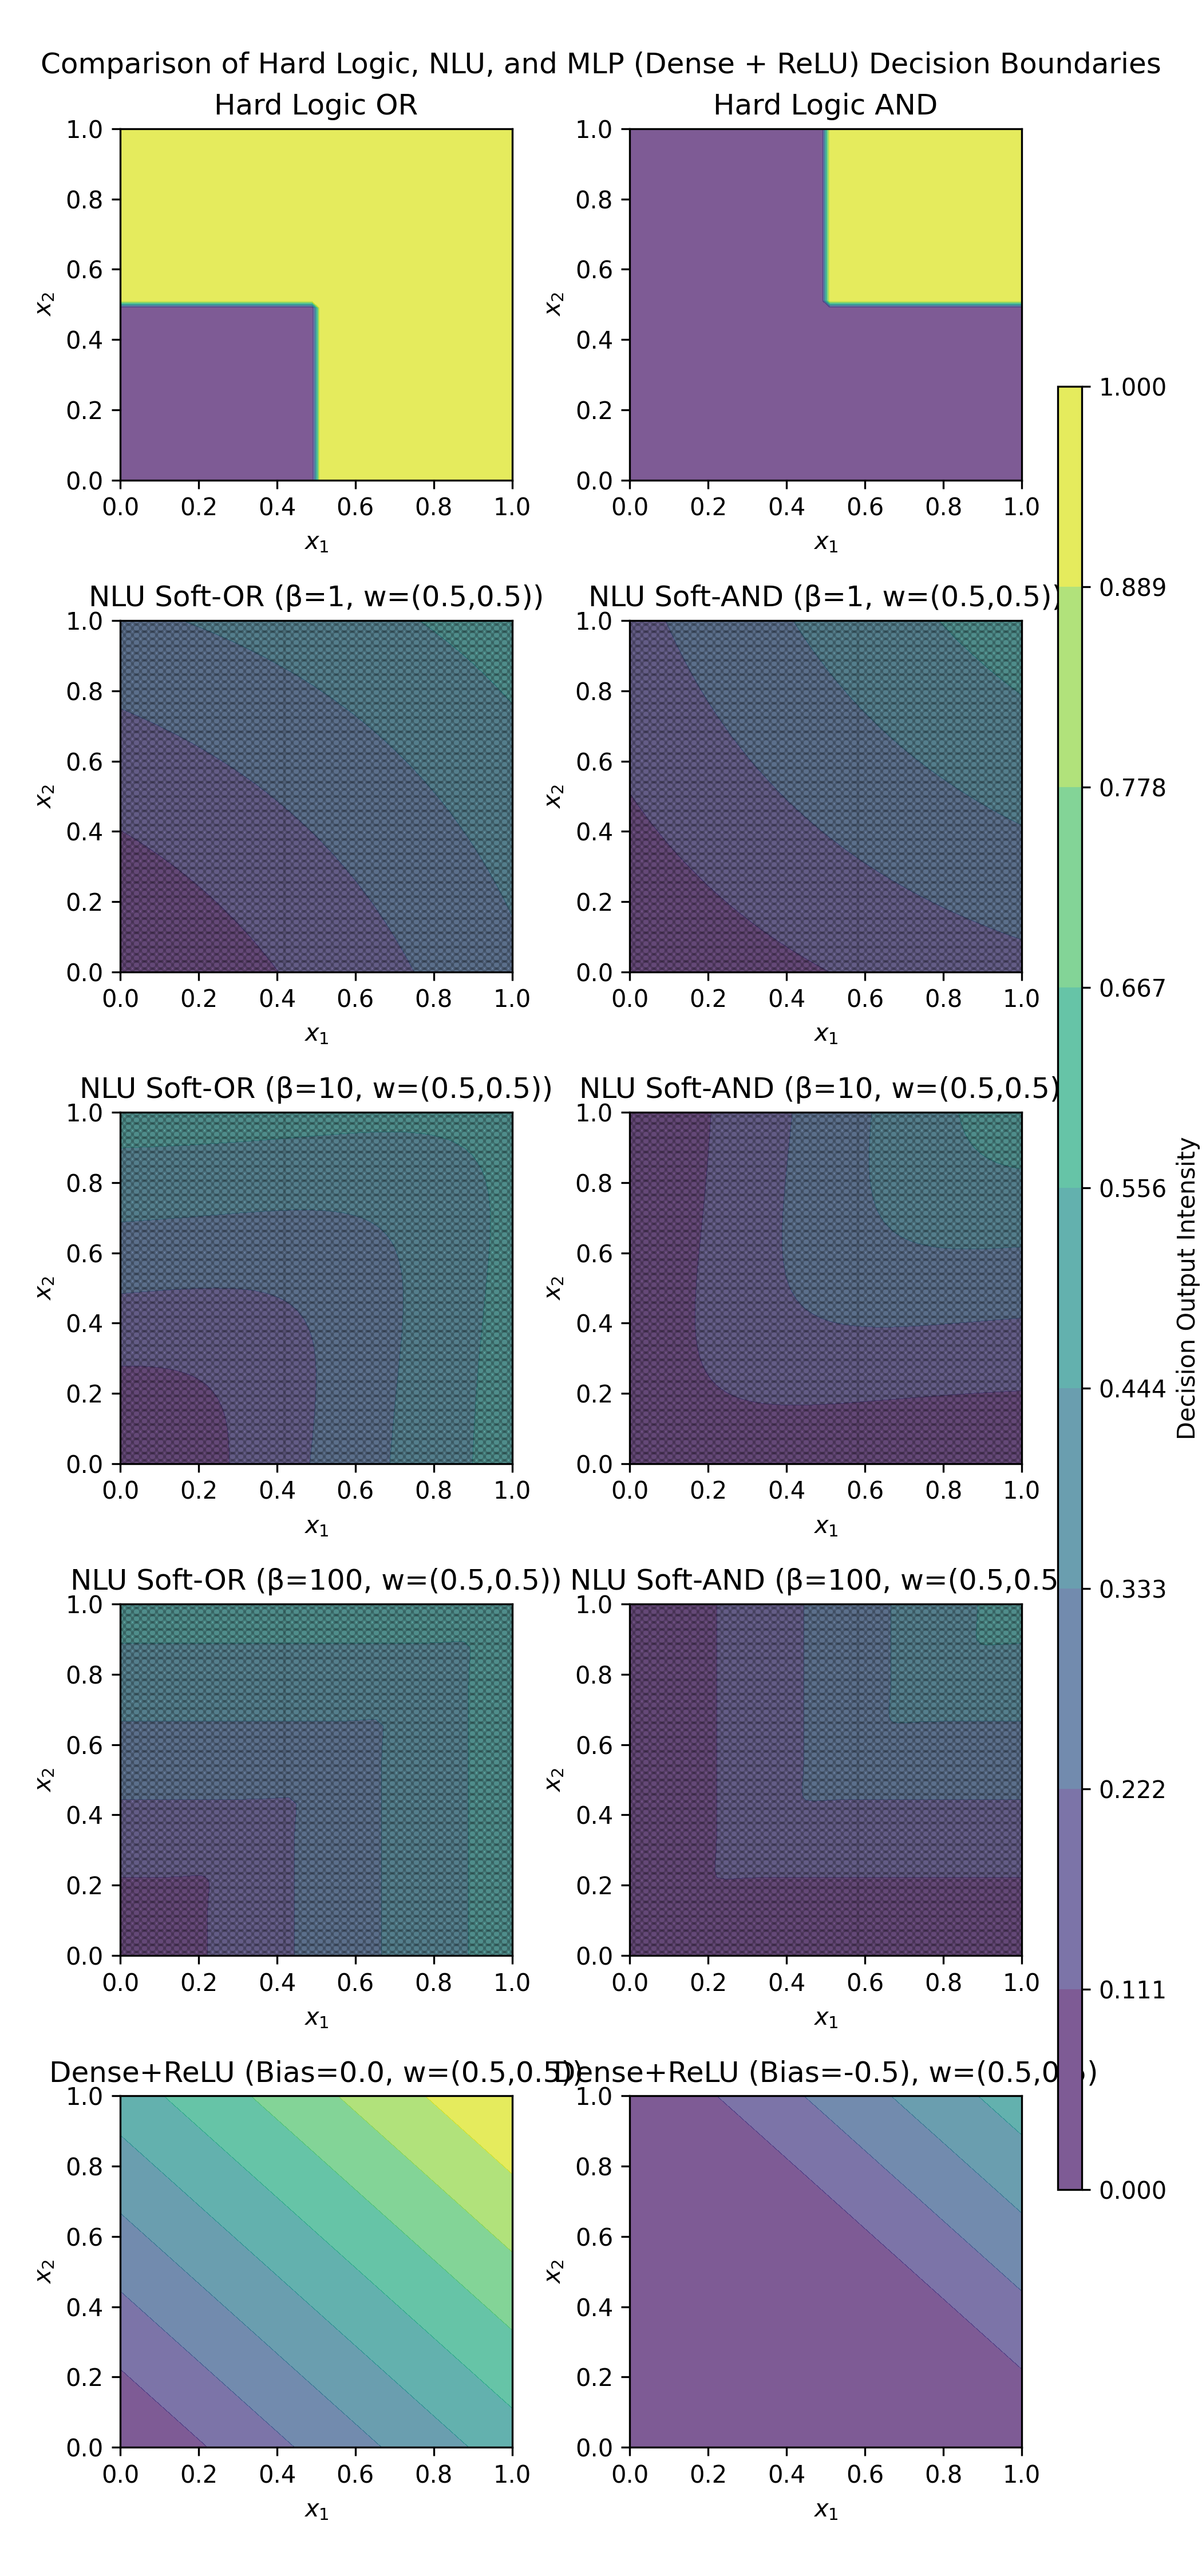
The image presents a comparison of decision boundaries generated by different models: Hard Logic (OR and AND), Neural Logic Units (NLU) with Soft-OR and Soft-AND, and Multilayer Perceptrons (MLP) with Dense + ReLU activation. The heatmaps visualize the decision output intensity for each model across a 2D input space (x1, x2).
### Components/Axes
* **Title:** Comparison of Hard Logic, NLU, and MLP (Dense + ReLU) Decision Boundaries
* **X-axis:** x1, ranging from 0.0 to 1.0
* **Y-axis:** x2, ranging from 0.0 to 1.0
* **Colorbar (Right):** Decision Output Intensity, ranging from 0.000 (dark purple) to 1.000 (yellow). Intermediate values are marked at 0.111, 0.222, 0.333, 0.444, 0.556, 0.667, 0.778, and 0.889.
* **Individual Plot Titles:**
* Hard Logic OR
* Hard Logic AND
* NLU Soft-OR (β=1, w=(0.5,0.5))
* NLU Soft-AND (β=1, w=(0.5,0.5))
* NLU Soft-OR (β=10, w=(0.5,0.5))
* NLU Soft-AND (β=10, w=(0.5,0.5))
* NLU Soft-OR (β=100, w=(0.5,0.5))
* NLU Soft-AND (β=100, w=(0.5,0.5))
* Dense+ReLU (Bias=0.0, w=(0.5,0.5))
* Dense+ReLU (Bias=-0.5, w=(0.5,0.5))
### Detailed Analysis
**Hard Logic:**
* **Hard Logic OR (Top-Left):** The decision boundary is a sharp corner. The region where either x1 or x2 is greater than approximately 0.5 is yellow (output intensity close to 1.0), while the region where both are less than 0.5 is purple (output intensity close to 0.0).
* **Hard Logic AND (Top-Right):** The decision boundary is also a sharp corner. The region where both x1 and x2 are greater than approximately 0.5 is yellow (output intensity close to 1.0), while the region where either is less than 0.5 is purple (output intensity close to 0.0).
**NLU (Neural Logic Units):**
* **NLU Soft-OR (β=1, w=(0.5,0.5)) (Middle-Left, Top Row):** The decision boundary is a smooth gradient. The output intensity increases as either x1 or x2 increases. The bottom-left corner is dark purple (close to 0.0), and the top-right corner is greenish-yellow (around 0.778).
* **NLU Soft-AND (β=1, w=(0.5,0.5)) (Middle-Right, Top Row):** The decision boundary is a smooth gradient. The output intensity increases as both x1 and x2 increase. The bottom-left corner is dark purple (close to 0.0), and the top-right corner is greenish-yellow (around 0.778).
* **NLU Soft-OR (β=10, w=(0.5,0.5)) (Middle-Left, Bottom Row):** The decision boundary is sharper than with β=1. The output intensity increases more rapidly as either x1 or x2 increases.
* **NLU Soft-AND (β=10, w=(0.5,0.5)) (Middle-Right, Bottom Row):** The decision boundary is sharper than with β=1. The output intensity increases more rapidly as both x1 and x2 increase.
* **NLU Soft-OR (β=100, w=(0.5,0.5)) (Bottom-Left, Top Row):** The decision boundary is even sharper, approaching the hard logic OR.
* **NLU Soft-AND (β=100, w=(0.5,0.5)) (Bottom-Right, Top Row):** The decision boundary is even sharper, approaching the hard logic AND.
**MLP (Multilayer Perceptron):**
* **Dense+ReLU (Bias=0.0, w=(0.5,0.5)) (Bottom-Left):** The decision boundary is a linear gradient. The output intensity increases linearly from the bottom-left to the top-right. The bottom-left corner is purple (close to 0.0), and the top-right corner is yellow (close to 1.0).
* **Dense+ReLU (Bias=-0.5, w=(0.5,0.5)) (Bottom-Right):** The decision boundary is a linear gradient. The output intensity increases linearly from the top-left to the bottom-right. The bottom-left corner is purple (close to 0.0), and the top-right corner is yellow (close to 1.0).
### Key Observations
* **Hard Logic:** Provides sharp, binary decision boundaries.
* **NLU:** Offers smooth, tunable decision boundaries. The β parameter controls the sharpness of the boundary; higher β values result in boundaries closer to hard logic.
* **MLP:** Generates linear decision boundaries. The bias term shifts the boundary.
* The 'w' parameter is consistently set to (0.5, 0.5) across all NLU and MLP models, indicating equal weighting for both input features x1 and x2.
### Interpretation
The image demonstrates how different models create decision boundaries in a 2D input space. Hard logic provides strict binary decisions, while NLU models offer a way to soften these decisions with a tunable parameter (β). As β increases, the NLU models approach the behavior of hard logic. The MLP models, on the other hand, produce linear decision boundaries, which can be shifted by adjusting the bias term.
The choice of model depends on the specific application and the desired level of flexibility in the decision-making process. If a strict binary decision is required, hard logic may be suitable. If a more nuanced decision is needed, NLU or MLP models may be more appropriate. The NLU models offer a way to bridge the gap between hard logic and more complex neural networks.