\n
## Diagram: Octree Processing Pipeline
### Overview
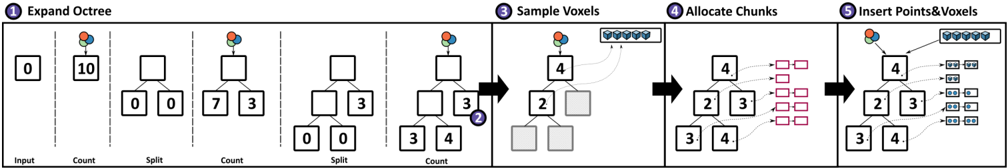
The image depicts a four-stage pipeline for processing an octree data structure. The stages are: Expand Octree, Sample Voxels, Allocate Chunks, and Insert Points & Voxels. Each stage visually demonstrates the transformation of data within the octree, with numerical values indicating counts or identifiers. The diagram uses a series of boxes representing octree nodes, arrows indicating data flow, and color-coded icons to represent different data types.
### Components/Axes
The diagram is divided into four columns, each representing a stage in the pipeline. Each column has a header indicating the stage name (1. Expand Octree, 2. Sample Voxels, 3. Allocate Chunks, 4. Insert Points & Voxels). Below each header is a visual representation of the octree structure at that stage. The bottom of each column has labels: "Input", "Count", "Split", and "Count". There are also icons at the top of each column representing data types. The icons are: a sphere, a cube, and a collection of smaller cubes.
### Detailed Analysis or Content Details
**Stage 1: Expand Octree**
* **Input:** A single box labeled "0" with the value "10" below it.
* **Split:** The initial box splits into eight smaller boxes. The values within these boxes are: 0, 0, 7, 3, 3, 0, 0, 3.
* **Count:** The final "Count" box shows the value "10".
**Stage 2: Sample Voxels**
* **Input:** The octree structure from Stage 1.
* **Sample Voxels:** Several boxes are shaded gray, indicating they are being sampled. The values within the remaining boxes are: 4, 3, 2, 4.
* **Count:** The final "Count" box shows the value "4".
**Stage 3: Allocate Chunks**
* **Input:** The octree structure from Stage 2.
* **Allocate Chunks:** Pink rectangles are connected to the octree nodes with arrows, representing chunk allocation. The values within the boxes are: 4, 2, 3, 4.
* **Count:** The final "Count" box shows the value "4".
**Stage 4: Insert Points & Voxels**
* **Input:** The octree structure from Stage 3.
* **Insert Points & Voxels:** The octree nodes now contain additional data represented by small, colored squares. The values within the boxes are: 4, 2, 3, 4.
* **Count:** The final "Count" box shows the value "4".
### Key Observations
* The "Count" value decreases from 10 in the first stage to 4 in the final stage. This suggests a reduction in the number of elements being processed.
* The graying out of boxes in Stage 2 indicates a sampling process, potentially filtering or selecting specific voxels.
* The pink rectangles in Stage 3 represent the allocation of chunks, likely for memory management or parallel processing.
* The addition of colored squares in Stage 4 indicates the insertion of points and voxels into the octree structure.
### Interpretation
This diagram illustrates a pipeline for processing octree data, likely for representing 3D space or volumetric data. The pipeline begins by expanding an initial octree node (0) into its eight children. The "Count" value represents the total number of elements within the octree. The subsequent stages involve sampling voxels, allocating chunks, and inserting points and voxels, ultimately resulting in a refined octree structure. The reduction in the "Count" value suggests that the sampling process filters out some voxels, while the chunk allocation and point insertion stages prepare the data for further processing or rendering. The diagram demonstrates a common approach to managing and processing large 3D datasets efficiently. The icons at the top of each stage suggest the data types being handled: a sphere (likely representing a point), a cube (representing a voxel), and a collection of smaller cubes (representing the octree structure itself).