## Chart: Game Performance Comparison - EWC vs. SGD vs. Single Game
### Overview
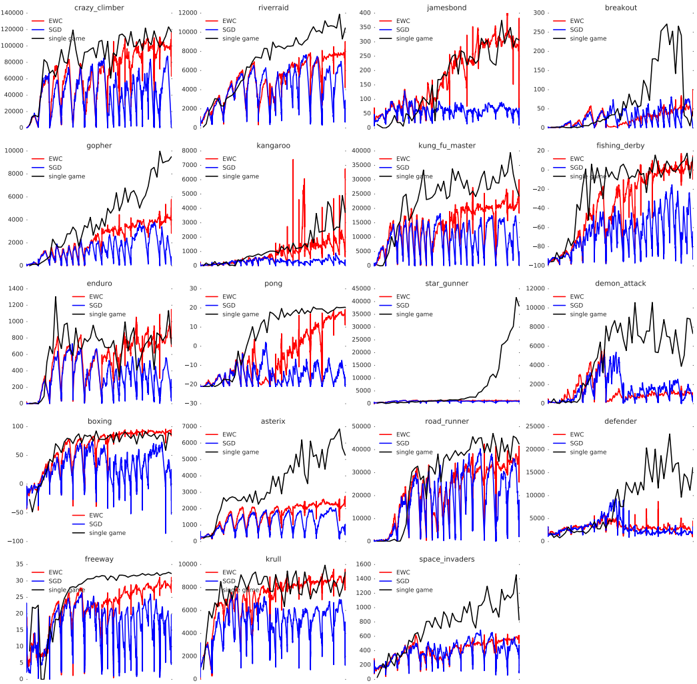
The image presents a grid of 16 line charts, each representing the performance of a different Atari game. Each chart compares three learning methods: Evolutionary Strategies with Covariance Matrix Adaptation (EWC - red line), Stochastic Gradient Descent (SGD - blue line), and a "single game" baseline (black line). The y-axis represents a score, and the x-axis represents the training step or episode.
### Components/Axes
* **Title:** Each chart is labeled with the name of the Atari game it represents (e.g., "crazy\_climber", "riverraid", "jamesbond").
* **X-axis:** Labeled "EWC", "SGD", and "single game". The x-axis represents the training step or episode number. The scale is not explicitly labeled, but appears to be linear and increasing from left to right.
* **Y-axis:** Represents the score achieved in the game. The scale varies significantly between games, ranging from -100 to 140000.
* **Legend:** Each chart has an implicit legend defined by the line colors:
* Red: EWC
* Blue: SGD
* Black: Single Game
* **Games:** The following games are represented:
1. crazy\_climber
2. riverraid
3. jamesbond
4. breakout
5. gopher
6. kangaroo
7. kung\_fu\_master
8. fishing\_derby
9. enduro
10. pong
11. star\_gunner
12. demon\_attack
13. boxing
14. asterix
15. road\_runner
16. defender
17. freeway
18. space\_invaders
### Detailed Analysis or Content Details
Here's a breakdown of the trends and approximate values for each game, noting the color-legend correspondence:
1. **crazy\_climber:** EWC (red) starts high and fluctuates around 100000-120000. SGD (blue) starts low and increases to around 60000. Single game (black) is relatively flat around 20000.
2. **riverraid:** EWC (red) increases steadily to around 12000. SGD (blue) increases rapidly to around 8000. Single game (black) remains relatively low, around 1000.
3. **jamesbond:** EWC (red) is relatively flat around 300. SGD (blue) fluctuates between 200 and 350. Single game (black) is around 150.
4. **breakout:** EWC (red) fluctuates around 250. SGD (blue) increases to around 300. Single game (black) is around 100.
5. **gopher:** EWC (red) increases to around 6000. SGD (blue) increases to around 8000. Single game (black) is around 2000.
6. **kangaroo:** EWC (red) decreases from 7000 to around 3000. SGD (blue) is relatively flat around 5000. Single game (black) is around 2000.
7. **kung\_fu\_master:** EWC (red) fluctuates around 40000. SGD (blue) increases to around 20000. Single game (black) is around -20.
8. **fishing\_derby:** EWC (red) decreases to around -20. SGD (blue) decreases to around -60. Single game (black) is around -100.
9. **enduro:** EWC (red) increases to around 1200. SGD (blue) increases to around 800. Single game (black) is around 200.
10. **pong:** EWC (red) is around 30. SGD (blue) is around 20. Single game (black) is around -10.
11. **star\_gunner:** EWC (red) increases to around 45000. SGD (blue) increases to around 30000. Single game (black) is around 10000.
12. **demon\_attack:** EWC (red) increases to around 12000. SGD (blue) increases to around 6000. Single game (black) is around 4000.
13. **boxing:** EWC (red) increases to around 8000. SGD (blue) increases to around 5000. Single game (black) is around 2000.
14. **asterix:** EWC (red) increases to around 6000. SGD (blue) increases to around 4000. Single game (black) is around 1000.
15. **road\_runner:** EWC (red) increases to around 25000. SGD (blue) increases to around 15000. Single game (black) is around 5000.
16. **defender:** EWC (red) increases to around 25000. SGD (blue) increases to around 20000. Single game (black) is around 10000.
17. **freeway:** EWC (red) increases to around 30000. SGD (blue) increases to around 20000. Single game (black) is around 10000.
18. **space\_invaders:** EWC (red) increases to around 40000. SGD (blue) increases to around 30000. Single game (black) is around 20000.
### Key Observations
* EWC generally outperforms SGD in many games, achieving higher scores and exhibiting more stable learning curves.
* SGD often shows faster initial learning in some games but can plateau or fluctuate more than EWC.
* The "single game" baseline consistently performs the worst across most games.
* The scale of the y-axis varies dramatically between games, indicating different scoring systems and difficulty levels.
* Some games (e.g., fishing\_derby) show negative scores for all methods, suggesting they are particularly challenging.
### Interpretation
The data suggests that EWC is a more effective learning algorithm than SGD for a wide range of Atari games. EWC's ability to maintain performance while learning new tasks (as indicated by the relatively stable learning curves) is a key advantage. SGD, while sometimes faster to start, is more prone to instability and may not reach the same level of performance as EWC. The consistently poor performance of the "single game" baseline highlights the importance of learning from multiple experiences to generalize effectively. The variation in y-axis scales underscores the diverse nature of the Atari game environment and the need for tailored learning strategies. The negative scores in some games indicate that achieving even basic competence in those games is difficult. The charts provide a comparative analysis of the algorithms' performance across a diverse set of tasks, offering insights into their strengths and weaknesses. The consistent outperformance of EWC suggests it may be a more robust and reliable algorithm for reinforcement learning in complex environments.