TECHNICAL ASSET FINGERPRINT
dba7d67759cdbf5f573bd69e
Click to view fullscreen
Press ESC or click to close
FOUND IN PAPERS
EXPERT: healer-alpha-free VERSION 1
RUNTIME: free/openrouter/healer-alpha
INTEL_VERIFIED
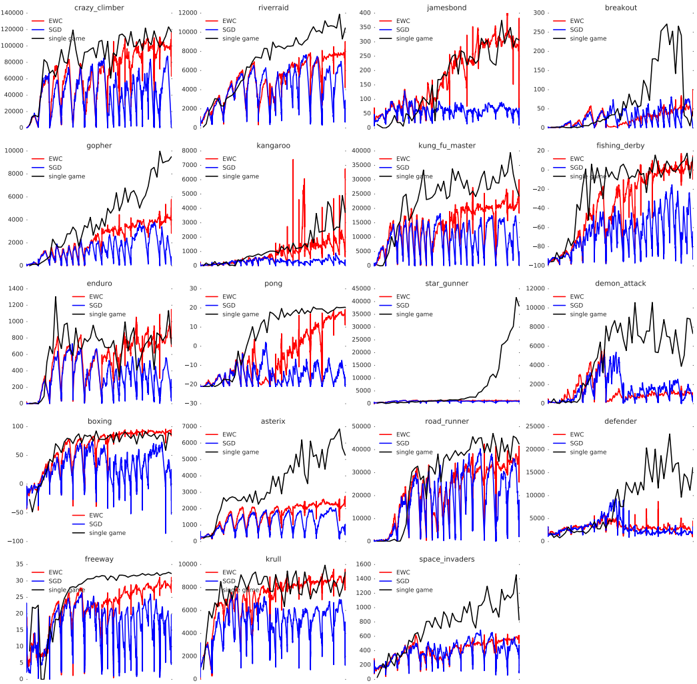
## [Multi-Panel Line Chart]: Performance Comparison of EWC, SGD, and Single-Game Training on Atari Games
### Overview
The image is a grid of 20 individual line charts arranged in a 5x4 layout. Each chart compares the training performance (likely score over time/steps) of three different machine learning approaches on a specific Atari 2600 game. The three approaches are represented by distinct colored lines: EWC (red), SGD (blue), and single game (black). The charts collectively demonstrate the comparative effectiveness of these continual learning methods across a diverse set of game environments.
### Components/Axes
* **Chart Grid:** 20 separate plots, each with its own title corresponding to an Atari game.
* **Game Titles (Top of each subplot):** `crazy_climber`, `riverraid`, `jamesbond`, `breakout`, `gopher`, `kangaroo`, `kung_fu_master`, `fishing_derby`, `enduro`, `pong`, `star_gunner`, `demon_attack`, `boxing`, `asterix`, `road_runner`, `defender`, `freeway`, `krull`, `space_invaders`. (Note: The grid is 5 columns wide, so the titles are: Row 1: crazy_climber, riverraid, jamesbond, breakout; Row 2: gopher, kangaroo, kung_fu_master, fishing_derby; Row 3: enduro, pong, star_gunner, demon_attack; Row 4: boxing, asterix, road_runner, defender; Row 5: freeway, krull, space_invaders).
* **Y-Axis:** Represents the game score. The scale varies significantly between games (e.g., from -100 to 300 for `fishing_derby` to 0 to 140000 for `crazy_climber`). Axis labels are numerical tick marks.
* **X-Axis:** Represents training progression (likely environment steps or epochs). The axis is not explicitly labeled with text but is implied by the progression of the lines from left to right.
* **Legend:** Located in the top-left corner of each individual subplot. It contains three entries:
* `EWC` (Red line)
* `SGD` (Blue line)
* `single game` (Black line)
### Detailed Analysis
**General Trend Across Most Games:**
1. **Single Game (Black):** This line typically shows the highest and most stable performance, often rising quickly and plateauing at a high score. This represents the upper-bound performance when a model is trained exclusively on that one game.
2. **EWC (Red):** This line generally performs better than SGD, often tracking closer to the single-game baseline. It shows more stability and less catastrophic forgetting, maintaining higher scores as training progresses.
3. **SGD (Blue):** This line frequently exhibits high volatility and lower overall performance. It often shows sharp drops in score, indicative of catastrophic forgetting when learning new tasks sequentially.
**Game-Specific Observations (Selected Examples):**
* **`crazy_climber`:** Single game (black) reaches ~120,000. EWC (red) stabilizes around 80,000-100,000. SGD (blue) is highly volatile, fluctuating between 20,000 and 80,000.
* **`riverraid`:** Single game peaks near 12,000. EWC maintains a score between 6,000-9,000. SGD is unstable, often dropping below 2,000.
* **`jamesbond`:** Single game reaches ~400. EWC fluctuates between 150-300. SGD is very low, mostly below 100.
* **`fishing_derby`:** Notable for negative scores. Single game stabilizes near 0. EWC fluctuates between -40 and 0. SGD performs poorly, often below -60.
* **`star_gunner`:** Single game shows a dramatic late rise to ~45,000. EWC and SGD remain very low (<5,000) throughout, suggesting both continual learning methods failed significantly on this task.
* **`boxing`:** All methods perform well. Single game and EWC converge near 100. SGD is also high but more volatile.
* **`freeway`:** Single game and EWC are very close, both reaching ~30-35. SGD is lower and unstable, often dropping to 10-20.
### Key Observations
1. **Consistent Hierarchy:** In 19 out of 20 charts, the performance order is: `single game` (best) > `EWC` > `SGD` (worst). The exception is `boxing`, where EWC and single game are nearly identical.
2. **Catastrophic Forgetting in SGD:** The blue (SGD) line shows extreme volatility and performance drops in nearly every game, visually demonstrating the problem of catastrophic forgetting in naive sequential learning.
3. **EWC Mitigates Forgetting:** The red (EWC) line is consistently smoother and higher than the blue line, showing that Elastic Weight Consolidation successfully preserves knowledge from previous tasks to a significant degree.
4. **Task Difficulty Variance:** The vast difference in y-axis scales indicates the inherent difficulty and scoring mechanics of each Atari game vary enormously.
5. **Failure Case:** The `star_gunner` chart is a clear outlier where both continual learning methods (EWC and SGD) fail to achieve any meaningful performance compared to the single-game baseline.
### Interpretation
This composite figure serves as a powerful empirical demonstration of a core challenge in continual (lifelong) learning for artificial intelligence: **catastrophic forgetting**. The data suggests:
* **The Problem:** Training a single neural network sequentially on different tasks using standard Stochastic Gradient Descent (SGD - blue lines) leads to severe performance degradation on previously learned tasks. The network "forgets" how to play earlier games as it learns new ones.
* **A Partial Solution:** The Elastic Weight Consolidation (EWC - red lines) algorithm provides a robust mitigation strategy. By identifying and protecting important neural connections for previous tasks, it allows the network to retain a significant portion of its prior knowledge, resulting in more stable and higher performance across a suite of tasks compared to naive SGD.
* **The Trade-off:** While EWC is effective, it does not fully match the performance of a model trained in isolation on a single game (black lines). This highlights the ongoing research gap between continual learning systems and specialized, single-task models.
* **Task-Specific Nuance:** The effectiveness of EWC varies by game. In some (`boxing`, `freeway`), it nearly matches single-task performance. In others (`star_gunner`), it fails completely. This suggests the algorithm's success depends on the nature of the tasks and the overlap or conflict in the neural resources they require.
In summary, the image provides a comprehensive visual benchmark showing that while catastrophic forgetting is a severe issue in sequential learning (SGD), biologically-inspired regularization methods like EWC offer a promising direction for building more general and stable learning agents.
DECODING INTELLIGENCE...