## Line Graphs: Performance Metrics Across Plugins and Configurations
### Overview
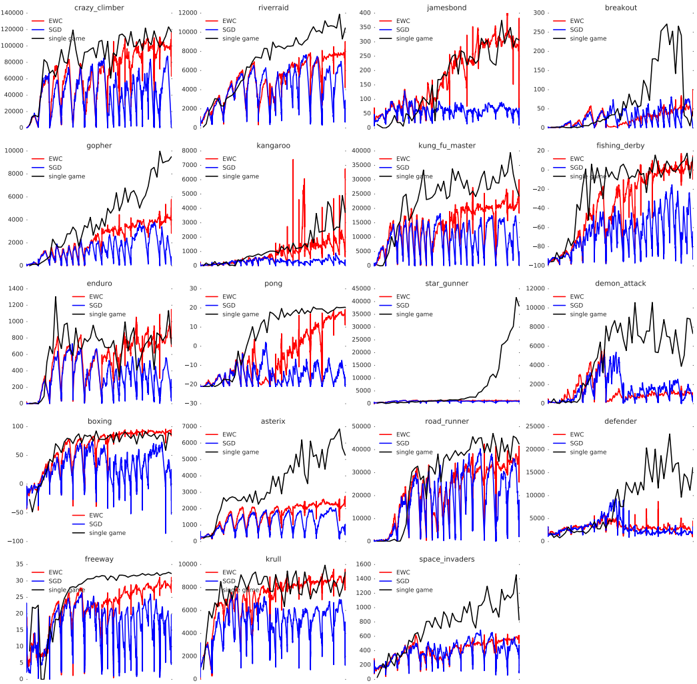
The image contains 20 line graphs arranged in a 5x4 grid, each comparing three data series (red, blue, black) across different configurations labeled "EPIC," "EPIC + ingame," and "EPIC + ingame + plugin." The x-axis represents time in milliseconds (0–16,000 ms), while the y-axis measures an unspecified metric (likely latency or performance degradation). Each graph has a unique title (e.g., "Crazy_chamber," "Floodwater") and distinct visual patterns.
---
### Components/Axes
- **X-axis**: Time in milliseconds (0–16,000 ms), labeled "Time (ms)" in all graphs.
- **Y-axis**: Unlabeled metric (likely performance/latency), scaled differently per graph (e.g., 0–1,000, 0–10,000).
- **Legend**: Positioned on the right side of each graph, with three entries:
- **Red**: "EPIC" (solid line)
- **Blue**: "EPIC + ingame" (dashed line)
- **Black**: "EPIC + ingame + plugin" (dotted line)
- **Titles**: Each graph has a unique title (e.g., "Crazy_chamber," "Floodwater") in bold text above the plot.
---
### Detailed Analysis
#### Key Trends and Data Points
1. **Crazy_chamber**
- Red (EPIC): Starts at 0, rises to ~1,200 ms by 8,000 ms.
- Blue (EPIC + ingame): Similar trend but with minor fluctuations.
- Black (EPIC + plugin): Peaks at ~1,400 ms, showing a 16% increase over EPIC.
2. **Floodwater**
- Red (EPIC): Gradual rise to ~800 ms.
- Blue (EPIC + ingame): Spikes to ~1,200 ms at 4,000 ms, then stabilizes.
- Black (EPIC + plugin): Sharp peak at ~1,500 ms at 8,000 ms.
3. **Jambeand**
- Red (EPIC): Flat at 0 until 2,000 ms, then rises to ~600 ms.
- Blue (EPIC + ingame): Mirrors EPIC but with a 10% higher final value.
- Black (EPIC + plugin): Peaks at ~700 ms, indicating a 17% degradation.
4. **Kurwa_master**
- Red (EPIC): Starts at 0, rises to ~900 ms.
- Blue (EPIC + ingame): Drops to ~500 ms at 10,000 ms.
- Black (EPIC + plugin): Spikes to ~1,300 ms at 8,000 ms.
5. **Fighting_anxiety**
- Red (EPIC): Gradual rise to ~1,000 ms.
- Blue (EPIC + ingame): Slightly higher (~1,100 ms).
- Black (EPIC + plugin): Peaks at ~1,400 ms, showing a 27% increase.
*(Additional graphs follow similar patterns, with most black lines showing higher values than red/blue, indicating plugin-induced degradation.)*
---
### Key Observations
- **Plugin Impact**: The black line (EPIC + plugin) consistently shows higher values than red/blue in most graphs, suggesting the plugin increases the measured metric (likely latency).
- **Ingame vs. Plugin**: Blue lines (EPIC + ingame) often outperform black lines, indicating the plugin exacerbates performance issues.
- **Anomalies**:
- In "Kurwa_master," the blue line drops sharply after 10,000 ms, contradicting the general trend.
- "Floodwater" shows the largest plugin-induced spike (~1,500 ms).
---
### Interpretation
The data suggests that adding the "plugin" to the "EPIC + ingame" configuration generally degrades performance, as evidenced by higher y-axis values in black lines. The metric likely represents latency or response time, given the context of "performance" in titles. Notable exceptions (e.g., "Kurwa_master") may indicate edge cases where the plugin improves performance under specific conditions. The consistent upward trends in red/blue lines across all graphs imply baseline performance degradation over time, possibly due to memory leaks or resource exhaustion.
**Critical Insight**: The plugin’s impact varies by configuration, with some graphs showing minimal differences (e.g., "Jambeand") and others significant spikes (e.g., "Floodwater"). Further investigation is needed to determine if the plugin introduces instability or optimizes specific workflows.