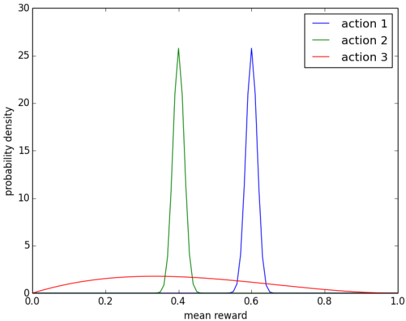
## Chart: Probability Density vs. Mean Reward for Different Actions
### Overview
The image is a chart displaying probability density functions for three different actions, plotted against the mean reward. Each action is represented by a different colored line, showing the distribution of potential rewards associated with that action.
### Components/Axes
* **X-axis:** "mean reward", ranging from 0.0 to 1.0 in increments of 0.2.
* **Y-axis:** "probability density", ranging from 0 to 30.
* **Legend (top-right):**
* Blue line: "action 1"
* Green line: "action 2"
* Red line: "action 3"
### Detailed Analysis
* **Action 1 (Blue):** The probability density function for action 1 is a narrow peak centered around a mean reward of approximately 0.6. The peak probability density is approximately 26.
* **Action 2 (Green):** The probability density function for action 2 is a narrow peak centered around a mean reward of approximately 0.4. The peak probability density is approximately 25.
* **Action 3 (Red):** The probability density function for action 3 is a wide, shallow curve. The peak probability density is approximately 1.5, occurring around a mean reward of approximately 0.2.
### Key Observations
* Actions 1 and 2 have much higher peak probability densities than action 3, indicating more certainty in their respective mean rewards.
* Action 1 has the highest mean reward (approximately 0.6), followed by action 2 (approximately 0.4), and then action 3 (approximately 0.2).
* Action 3 has a much wider distribution, indicating a higher degree of uncertainty in the potential rewards.
### Interpretation
The chart suggests that action 1 is the most likely to yield a high reward, as it has both a high mean reward and a high probability density. Action 2 is also likely to yield a reward, but with a slightly lower mean. Action 3, while still potentially yielding a reward, has a much lower probability density and a lower mean reward, making it a less desirable choice. The narrow peaks of actions 1 and 2 indicate that the rewards are more predictable, while the wide distribution of action 3 suggests a higher degree of risk or variability.