## Probability Density Plot: Mean Reward Distributions for Three Actions
### Overview
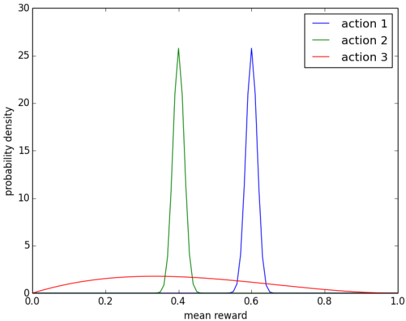
The image is a 2D line chart displaying the probability density functions (PDFs) for the "mean reward" associated with three distinct actions. The chart compares the central tendency and spread (variance) of the reward distributions for each action.
### Components/Axes
* **Chart Type:** Probability Density Plot (Line Chart).
* **X-Axis:**
* **Label:** `mean reward`
* **Scale:** Linear, ranging from 0.0 to 1.0.
* **Major Ticks:** 0.0, 0.2, 0.4, 0.6, 0.8, 1.0.
* **Y-Axis:**
* **Label:** `probability density`
* **Scale:** Linear, ranging from 0 to 30.
* **Major Ticks:** 0, 5, 10, 15, 20, 25, 30.
* **Legend:**
* **Position:** Top-right corner of the plot area.
* **Entries:**
* `action 1` - Blue line.
* `action 2` - Green line.
* `action 3` - Red line.
### Detailed Analysis
The plot contains three distinct curves, each representing the probability density of achieving a certain mean reward for a given action.
1. **Action 1 (Blue Line):**
* **Trend:** A very sharp, narrow, and tall peak.
* **Peak Location:** The peak is centered at approximately `mean reward = 0.6`.
* **Peak Height:** The peak reaches a `probability density` of approximately 26.
* **Spread:** The distribution is highly concentrated, with the visible base spanning roughly from 0.55 to 0.65 on the x-axis. This indicates very low variance; the mean reward for action 1 is consistently near 0.6.
2. **Action 2 (Green Line):**
* **Trend:** A sharp, narrow peak, similar in shape to action 1 but slightly less tall.
* **Peak Location:** The peak is centered at approximately `mean reward = 0.4`.
* **Peak Height:** The peak reaches a `probability density` of approximately 25.5.
* **Spread:** The distribution is also highly concentrated, with a visible base spanning roughly from 0.35 to 0.45. This indicates very low variance; the mean reward for action 2 is consistently near 0.4.
3. **Action 3 (Red Line):**
* **Trend:** A very broad, flat, and low curve.
* **Peak Location:** The curve has a very gentle, broad maximum. The highest point appears to be in the region of `mean reward = 0.3 to 0.4`.
* **Peak Height:** The maximum `probability density` is very low, approximately 2.
* **Spread:** The distribution is extremely wide, with non-zero density spanning almost the entire visible x-axis from 0.0 to 1.0. This indicates extremely high variance; the mean reward for action 3 is highly uncertain and can take on a wide range of values.
### Key Observations
* **Distinct Central Tendencies:** Actions 1 and 2 have clearly defined, non-overlapping central rewards (~0.6 and ~0.4, respectively). Action 3's central tendency is less defined due to its flatness.
* **Variance Contrast:** There is a dramatic difference in variance. Actions 1 and 2 are low-variance (predictable), while action 3 is extremely high-variance (unpredictable).
* **Peak Height vs. Width:** The chart demonstrates the fundamental property of probability distributions: the area under each curve integrates to 1. Therefore, the narrow curves (actions 1 & 2) must be tall, while the wide curve (action 3) must be short.
* **Spatial Overlap:** The tails of the green (action 2) and blue (action 1) curves do not appear to overlap significantly at their bases. The red curve (action 3) underlies both of them.
### Interpretation
This chart visualizes the risk-reward profiles of three different strategies or decisions (actions).
* **Action 1** is a **high-reward, low-risk** option. It reliably yields a mean reward around 0.6 with very little deviation.
* **Action 2** is a **moderate-reward, low-risk** option. It reliably yields a mean reward around 0.4 with very little deviation.
* **Action 3** is a **high-uncertainty** option. While its most likely rewards are in the low-to-moderate range (0.3-0.4), there is a significant probability of achieving very low rewards (near 0) or very high rewards (near 1). It represents a "wildcard" or gamble.
The choice between actions depends on the decision-maker's objective and risk tolerance. If consistency and predictability are key, actions 1 or 2 are preferable, with action 1 being superior if the goal is to maximize the expected reward. If the goal is to potentially achieve the highest possible reward (1.0) and the decision-maker can tolerate the risk of very low outcomes, action 3 becomes a consideration. The chart effectively argues that action 3's high variance makes it a fundamentally different kind of choice compared to the precise, targeted outcomes of actions 1 and 2.