## Line Graph: Probability Density of Mean Reward by Action
### Overview
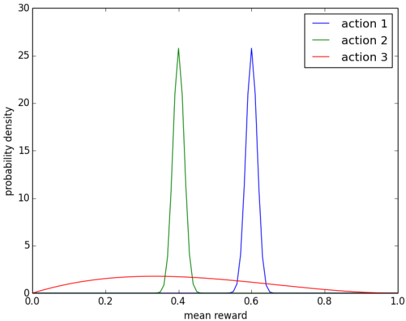
The image is a line graph depicting the probability density distribution of mean rewards for three distinct actions (Action 1, Action 2, Action 3). The x-axis represents "mean reward" (ranging from 0.0 to 1.0), and the y-axis represents "probability density" (ranging from 0 to 30). Three colored lines correspond to the actions, with peaks indicating the most probable mean reward values.
### Components/Axes
- **X-axis (Horizontal)**: Labeled "mean reward," scaled from 0.0 to 1.0 in increments of 0.2.
- **Y-axis (Vertical)**: Labeled "probability density," scaled from 0 to 30 in increments of 5.
- **Legend**: Located in the top-right corner, with three entries:
- **Action 1**: Blue line.
- **Action 2**: Green line.
- **Action 3**: Red line.
### Detailed Analysis
1. **Action 1 (Blue Line)**:
- **Peak**: Approximately at **mean reward = 0.6**.
- **Probability Density**: Peaks at **~25**.
- **Trend**: Sharp, narrow peak, indicating high certainty in the mean reward value.
2. **Action 2 (Green Line)**:
- **Peak**: Approximately at **mean reward = 0.4**.
- **Probability Density**: Peaks at **~25**.
- **Trend**: Sharp, narrow peak, similar to Action 1 but shifted leftward.
3. **Action 3 (Red Line)**:
- **Peak**: Approximately at **mean reward = 0.3**.
- **Probability Density**: Peaks at **~2**.
- **Trend**: Broad, shallow curve with a gradual rise and fall, indicating higher variability in mean rewards.
### Key Observations
- **Actions 1 and 2** exhibit nearly identical peak probability densities (~25) but differ in their mean reward values (0.6 vs. 0.4).
- **Action 3** has a significantly lower peak density (~2) and a broader distribution, suggesting greater uncertainty in its mean reward.
- The red line (Action 3) does not exhibit a sharp peak, implying a more dispersed or variable outcome compared to the other actions.
### Interpretation
The graph demonstrates that **Action 1** and **Action 2** are associated with higher and more concentrated mean rewards (0.6 and 0.4, respectively), while **Action 3** yields lower and more variable rewards (mean ~0.3). The sharp peaks for Actions 1 and 2 suggest these actions are more reliable or consistent in achieving their respective mean rewards, whereas Action 3’s broader distribution indicates higher risk or unpredictability. This could imply that Actions 1 and 2 are preferable in scenarios prioritizing mean reward maximization, while Action 3 may be less optimal due to its lower and more variable outcomes.