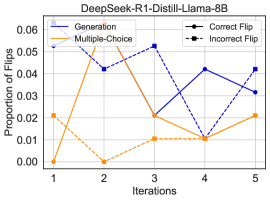
## Line Chart: DeepSeek-R1-Distill-Llama-8B
### Overview
The image is a line chart comparing the proportion of flips across iterations for different models and flip types. The chart displays data for "Generation" and "Multiple-Choice" models, as well as "Correct Flip" and "Incorrect Flip" types. The x-axis represents iterations (1 to 5), and the y-axis represents the proportion of flips.
### Components/Axes
* **Title:** DeepSeek-R1-Distill-Llama-8B
* **X-axis:** Iterations (labeled 1, 2, 3, 4, 5)
* **Y-axis:** Proportion of Flips (labeled 0.00, 0.01, 0.02, 0.03, 0.04, 0.05, 0.06)
* **Legend:** Located in the top-left and top-right corners.
* **Generation:** Solid light-blue line
* **Multiple-Choice:** Solid orange line
* **Correct Flip:** Solid black line with circle markers
* **Incorrect Flip:** Dashed black line with square markers
### Detailed Analysis
* **Generation (Solid light-blue line):** Starts at approximately 0.06 at iteration 1, decreases to approximately 0.042 at iteration 2, decreases further to approximately 0.02 at iteration 3, increases to approximately 0.042 at iteration 4, and decreases to approximately 0.032 at iteration 5.
* **Multiple-Choice (Solid orange line):** Starts at approximately 0.00 at iteration 1, increases to approximately 0.055 at iteration 2, decreases to approximately 0.02 at iteration 3, decreases further to approximately 0.01 at iteration 4, and increases to approximately 0.02 at iteration 5.
* **Correct Flip (Solid black line with circle markers):** Starts at approximately 0.02 at iteration 1, decreases to approximately 0.00 at iteration 2, increases to approximately 0.01 at iteration 3, increases further to approximately 0.01 at iteration 4, and increases to approximately 0.02 at iteration 5.
* **Incorrect Flip (Dashed black line with square markers):** Starts at approximately 0.02 at iteration 1, decreases to approximately 0.00 at iteration 2, increases to approximately 0.052 at iteration 3, decreases to approximately 0.01 at iteration 4, and increases to approximately 0.042 at iteration 5.
### Key Observations
* The "Multiple-Choice" model has a higher proportion of flips at iteration 2 compared to the "Generation" model.
* Both "Correct Flip" and "Incorrect Flip" types show a similar trend, with a low proportion of flips at iteration 2 and a peak at iteration 3.
* The proportion of flips for "Generation" is generally higher than "Multiple-Choice" except at iteration 2.
### Interpretation
The chart illustrates the performance of the DeepSeek-R1-Distill-Llama-8B model across different iterations, comparing the proportion of flips for "Generation" and "Multiple-Choice" models, as well as "Correct Flip" and "Incorrect Flip" types. The data suggests that the model's behavior changes across iterations, with varying levels of flips for different tasks. The "Multiple-Choice" model shows a spike in flips at iteration 2, while both "Correct Flip" and "Incorrect Flip" types peak at iteration 3. The "Generation" model generally has a higher proportion of flips, indicating potential differences in how it handles the task compared to the "Multiple-Choice" model. The trends and fluctuations in the proportion of flips across iterations may reflect the model's learning process and adaptation to the task.