\n
## Line Chart: DeepSeek-R1-Distill-Llama-8B Performance
### Overview
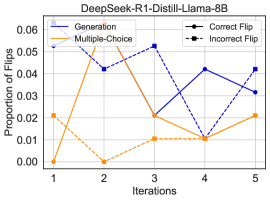
This image presents a line chart illustrating the proportion of flips across different iterations for a model named DeepSeek-R1-Distill-Llama-8B. The chart compares the performance of "Generation" and "Multiple-Choice" methods against "Correct Flip" and "Incorrect Flip" outcomes. The x-axis represents iterations (1 to 5), and the y-axis represents the proportion of flips, ranging from 0.00 to 0.06.
### Components/Axes
* **Title:** DeepSeek-R1-Distill-Llama-8B
* **X-axis Label:** Iterations (with markers 1, 2, 3, 4, 5)
* **Y-axis Label:** Proportion of Flips (with markers 0.00, 0.02, 0.04, 0.06)
* **Legend:**
* Generation (Blue Solid Line)
* Multiple-Choice (Orange Solid Line)
* Correct Flip (Black Dashed Line)
* Incorrect Flip (Brown Dashed Line)
### Detailed Analysis
The chart displays four distinct lines representing the trends of each category over the five iterations.
* **Generation (Blue Solid Line):** This line starts at approximately 0.055 at iteration 1, decreases to around 0.042 at iteration 2, rises to a peak of approximately 0.052 at iteration 3, dips to around 0.044 at iteration 4, and then decreases to approximately 0.035 at iteration 5. The trend is generally fluctuating around 0.04-0.05.
* **Multiple-Choice (Orange Solid Line):** This line begins at approximately 0.02 at iteration 1, sharply increases to a peak of approximately 0.052 at iteration 2, then declines to around 0.022 at iteration 3, slightly increases to approximately 0.025 at iteration 4, and finally rises to approximately 0.03 at iteration 5. The trend shows a significant initial increase followed by a gradual decline and then a slight increase.
* **Correct Flip (Black Dashed Line):** This line starts at approximately 0.03 at iteration 1, decreases to around 0.015 at iteration 2, rises to approximately 0.02 at iteration 3, dips to a minimum of approximately 0.01 at iteration 4, and then increases to approximately 0.018 at iteration 5. The trend is relatively stable, fluctuating around 0.01-0.03.
* **Incorrect Flip (Brown Dashed Line):** This line begins at approximately 0.022 at iteration 1, decreases to a minimum of approximately 0.005 at iteration 2, rises to approximately 0.015 at iteration 3, dips to approximately 0.01 at iteration 4, and then increases to approximately 0.02 at iteration 5. The trend shows a significant initial decrease followed by a gradual increase.
### Key Observations
* The "Multiple-Choice" method exhibits the most dramatic change in proportion of flips, with a large increase in the early iterations.
* "Generation" and "Multiple-Choice" lines cross at iteration 2, indicating a shift in relative performance.
* "Correct Flip" and "Incorrect Flip" remain relatively low and stable throughout the iterations.
* The "Incorrect Flip" proportion is consistently higher than the "Correct Flip" proportion, suggesting a higher rate of errors.
### Interpretation
The data suggests that the "Multiple-Choice" method initially experiences a significant increase in flips, potentially indicating a period of rapid learning or adjustment. However, this increase is followed by a decline, suggesting that the method may reach a plateau or encounter limitations. The "Generation" method shows a more stable performance, fluctuating around a consistent level. The low and stable proportions of "Correct Flip" and "Incorrect Flip" suggest that these outcomes are less frequent or less sensitive to the iterations. The higher proportion of "Incorrect Flip" compared to "Correct Flip" indicates that the model is more prone to making incorrect flips, which could be a point of concern for further investigation. The chart provides insights into the dynamic behavior of the DeepSeek-R1-Distill-Llama-8B model across different iterations and methods, highlighting potential areas for improvement and optimization.