## Line Chart: DeepSeek-R1-Distill-Llama-8B - Proportion of Flips Over Iterations
### Overview
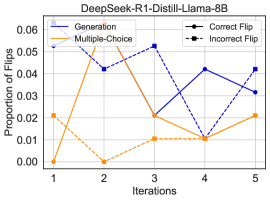
The image is a line chart displaying the performance of a model named "DeepSeek-R1-Distill-Llama-8B" across five iterations. It tracks the "Proportion of Flips" for four distinct categories, comparing two primary methods ("Generation" and "Multiple-Choice") and two specific flip outcomes ("Correct Flip" and "Incorrect Flip").
### Components/Axes
* **Chart Title:** "DeepSeek-R1-Distill-Llama-8B" (centered at the top).
* **X-Axis:** Labeled "Iterations". It has five discrete, equally spaced tick marks labeled 1, 2, 3, 4, and 5.
* **Y-Axis:** Labeled "Proportion of Flips". The scale ranges from 0.00 to 0.06, with major tick marks at intervals of 0.01 (0.00, 0.01, 0.02, 0.03, 0.04, 0.05, 0.06).
* **Legend:** Located in the top-right corner of the plot area. It defines four data series:
1. **Generation:** Solid blue line.
2. **Multiple-Choice:** Solid orange line.
3. **Correct Flip:** Dashed blue line.
4. **Incorrect Flip:** Dashed orange line.
### Detailed Analysis
**Data Series Trends and Approximate Values:**
1. **Generation (Solid Blue Line):**
* **Trend:** Starts low, rises sharply to a peak at iteration 2, then declines steadily through iterations 3 and 4, with a slight recovery at iteration 5.
* **Approximate Values:**
* Iteration 1: ~0.00
* Iteration 2: ~0.055 (Peak)
* Iteration 3: ~0.02
* Iteration 4: ~0.01
* Iteration 5: ~0.02
2. **Multiple-Choice (Solid Orange Line):**
* **Trend:** Shows a fluctuating pattern. It starts at a moderate level, drops to near zero, rises slightly, dips again, and ends at a moderate level similar to its start.
* **Approximate Values:**
* Iteration 1: ~0.02
* Iteration 2: ~0.00 (Trough)
* Iteration 3: ~0.01
* Iteration 4: ~0.01
* Iteration 5: ~0.02
3. **Correct Flip (Dashed Blue Line):**
* **Trend:** Begins very low, increases to a peak at iteration 3, then decreases through iterations 4 and 5.
* **Approximate Values:**
* Iteration 1: ~0.00
* Iteration 2: ~0.04
* Iteration 3: ~0.055 (Peak)
* Iteration 4: ~0.04
* Iteration 5: ~0.035
4. **Incorrect Flip (Dashed Orange Line):**
* **Trend:** Starts at its highest point, drops sharply to a low level, and remains relatively flat and low for the remaining iterations.
* **Approximate Values:**
* Iteration 1: ~0.04 (Peak)
* Iteration 2: ~0.01
* Iteration 3: ~0.01
* Iteration 4: ~0.01
* Iteration 5: ~0.01
### Key Observations
* **Peak Performance:** The highest recorded proportion of flips (~0.055) occurs for two different series at different times: "Generation" peaks at iteration 2, and "Correct Flip" peaks at iteration 3.
* **Initial Anomaly:** The "Incorrect Flip" series has its maximum value at the very first iteration, which is notably higher than its values for all subsequent iterations.
* **Convergence at Iteration 4:** At iteration 4, the "Generation" and "Multiple-Choice" lines converge at approximately the same low value (~0.01).
* **Diverging Paths:** The "Correct Flip" (dashed blue) and "Incorrect Flip" (dashed orange) lines show opposite trends in the early iterations. "Correct Flip" rises from iteration 1 to 3, while "Incorrect Flip" falls sharply from iteration 1 to 2.
* **Final State:** By iteration 5, the "Correct Flip" proportion remains the highest among all series, while "Multiple-Choice" and "Generation" have recovered to similar, moderate levels.
### Interpretation
This chart likely visualizes the behavior of a language model (DeepSeek-R1-Distill-Llama-8B) during a self-correction or refinement process over multiple iterations. The "Proportion of Flips" probably refers to the rate at which the model changes its initial answer.
* **Method Comparison:** The "Generation" method (solid blue) shows a high initial flip rate that quickly diminishes, suggesting early, aggressive self-correction that stabilizes. The "Multiple-Choice" method (solid orange) maintains a lower, more stable flip rate throughout.
* **Quality of Corrections:** The "Correct Flip" (dashed blue) series is crucial. Its rise to a peak at iteration 3 indicates that the model's self-corrections were most frequently *improving* its answers during the middle phase of the process. The subsequent decline suggests diminishing returns or stabilization.
* **Error Introduction:** The high initial "Incorrect Flip" (dashed orange) rate at iteration 1 is a significant finding. It implies that the model's first attempt at self-correction was often detrimental, introducing errors. This rate drops dramatically and stays low, indicating the model quickly learns to avoid making bad corrections.
* **Overall Process Narrative:** The data suggests a process where the model initially makes many changes, some of which are harmful (high Incorrect Flip at iter 1). It then enters a phase of more beneficial self-correction (rising Correct Flip, peaking at iter 3). Finally, the system stabilizes, with lower overall flip rates and a sustained, though reduced, rate of beneficial corrections. The convergence of the two primary methods at iteration 4 might indicate a point where different correction strategies yield similar, minimal change.