## Chart: CDF of E2E Latency
### Overview
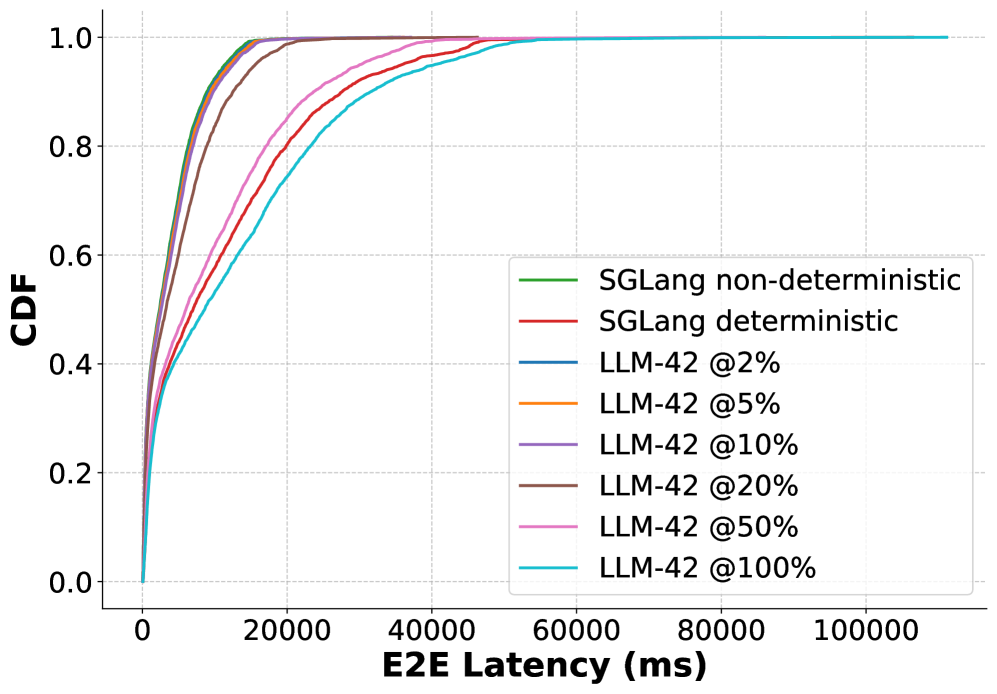
The image is a cumulative distribution function (CDF) plot comparing the end-to-end (E2E) latency of SGLang (both non-deterministic and deterministic versions) and LLM-42 at various sparsity levels (2%, 5%, 10%, 20%, 50%, and 100%). The x-axis represents E2E latency in milliseconds (ms), and the y-axis represents the cumulative distribution function (CDF), ranging from 0 to 1.
### Components/Axes
* **X-axis:** E2E Latency (ms), with ticks at 0, 20000, 40000, 60000, 80000, and 100000.
* **Y-axis:** CDF, with ticks at 0.0, 0.2, 0.4, 0.6, 0.8, and 1.0.
* **Legend:** Located on the right side of the plot, it identifies each line by color and label:
* Green: SGLang non-deterministic
* Red: SGLang deterministic
* Blue: LLM-42 @2%
* Orange: LLM-42 @5%
* Purple: LLM-42 @10%
* Brown: LLM-42 @20%
* Pink: LLM-42 @50%
* Teal: LLM-42 @100%
### Detailed Analysis
* **SGLang non-deterministic (Green):** The CDF rises sharply from 0 to 1 between approximately 0 ms and 5000 ms.
* **SGLang deterministic (Red):** The CDF rises sharply from 0 to 1 between approximately 0 ms and 15000 ms.
* **LLM-42 @2% (Blue):** The CDF rises sharply from 0 to 1 between approximately 0 ms and 10000 ms.
* **LLM-42 @5% (Orange):** The CDF rises sharply from 0 to 1 between approximately 0 ms and 12000 ms.
* **LLM-42 @10% (Purple):** The CDF rises sharply from 0 to 1 between approximately 0 ms and 20000 ms.
* **LLM-42 @20% (Brown):** The CDF rises sharply from 0 to 1 between approximately 0 ms and 20000 ms.
* **LLM-42 @50% (Pink):** The CDF rises sharply from 0 to 1 between approximately 0 ms and 40000 ms.
* **LLM-42 @100% (Teal):** The CDF rises sharply from 0 to 1 between approximately 0 ms and 40000 ms.
### Key Observations
* SGLang non-deterministic has the lowest E2E latency, followed by LLM-42 @2% and LLM-42 @5%.
* SGLang deterministic has a higher E2E latency than SGLang non-deterministic.
* LLM-42 @10% and LLM-42 @20% have similar E2E latency distributions.
* LLM-42 @50% and LLM-42 @100% have the highest E2E latencies among the LLM-42 variants.
### Interpretation
The CDF plot illustrates the impact of sparsity on the E2E latency of LLM-42 and compares it to SGLang. Lower sparsity levels (2% and 5%) result in lower latencies, approaching the performance of SGLang. As sparsity increases (10%, 20%, 50%, and 100%), the E2E latency of LLM-42 increases significantly. The deterministic version of SGLang has a higher latency than the non-deterministic version. This suggests that sparsity can be used to trade off model size and performance, but there are diminishing returns as sparsity increases beyond a certain point. The plot highlights the performance differences between different configurations and provides insights into the latency characteristics of these systems.