## Chart: gSSNR gain vs. TotER^{ITF}
### Overview
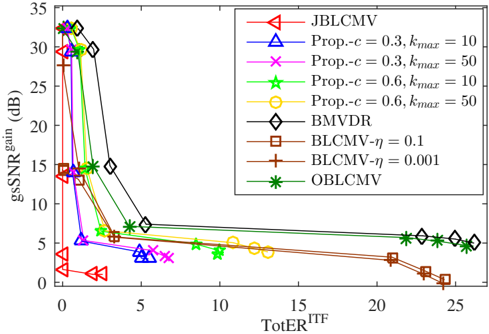
The image is a 2D line chart comparing the performance of different algorithms (JBLCMV, Prop, BMVDR, BLCMV, OBLCMV) based on their gSSNR gain (in dB) versus TotER^{ITF}. Each algorithm is represented by a different colored line with a unique marker. The chart shows how the gSSNR gain changes as TotER^{ITF} increases.
### Components/Axes
* **X-axis:** TotER^{ITF}. Scale ranges from 0 to 25, with tick marks at intervals of 5.
* **Y-axis:** gSSNR gain (dB). Scale ranges from 0 to 35, with tick marks at intervals of 5.
* **Legend:** Located in the top-right of the chart, it identifies each algorithm by color and marker.
* Red triangle pointing right: JBLCMV
* Blue triangle pointing up: Prop.-c = 0.3, k_{max} = 10
* Magenta cross: Prop.-c = 0.3, k_{max} = 50
* Lime green star: Prop.-c = 0.6, k_{max} = 10
* Yellow circle: Prop.-c = 0.6, k_{max} = 50
* Black diamond: BMVDR
* Brown square: BLCMV-η = 0.1
* Dark red plus sign: BLCMV-η = 0.001
* Green asterisk: OBLCMV
### Detailed Analysis
* **JBLCMV (Red Triangles):** The gSSNR gain starts around 3 dB at TotER^{ITF} = 0, then decreases to approximately 1 dB as TotER^{ITF} approaches 1.
* **Prop.-c = 0.3, k_{max} = 10 (Blue Triangles):** The gSSNR gain starts around 30 dB at TotER^{ITF} = 0, then decreases to approximately 4 dB as TotER^{ITF} approaches 5.
* **Prop.-c = 0.3, k_{max} = 50 (Magenta Crosses):** The gSSNR gain starts around 30 dB at TotER^{ITF} = 0, then decreases to approximately 4 dB as TotER^{ITF} approaches 5.
* **Prop.-c = 0.6, k_{max} = 10 (Lime Green Stars):** The gSSNR gain starts around 32 dB at TotER^{ITF} = 0, then decreases to approximately 5 dB as TotER^{ITF} approaches 10.
* **Prop.-c = 0.6, k_{max} = 50 (Yellow Circles):** The gSSNR gain starts around 30 dB at TotER^{ITF} = 0, then decreases to approximately 5 dB as TotER^{ITF} approaches 10.
* **BMVDR (Black Diamonds):** The gSSNR gain starts around 33 dB at TotER^{ITF} = 0, then decreases to approximately 6 dB as TotER^{ITF} approaches 5, and then decreases slowly to approximately 5 dB as TotER^{ITF} approaches 25.
* **BLCMV-η = 0.1 (Brown Squares):** The gSSNR gain starts around 14 dB at TotER^{ITF} = 0, then decreases to approximately 1 dB as TotER^{ITF} approaches 25.
* **BLCMV-η = 0.001 (Dark Red Plus Signs):** The gSSNR gain starts around 14 dB at TotER^{ITF} = 0, then decreases to approximately 1 dB as TotER^{ITF} approaches 25.
* **OBLCMV (Green Asterisks):** The gSSNR gain starts around 30 dB at TotER^{ITF} = 0, then decreases to approximately 5 dB as TotER^{ITF} approaches 10, and then remains relatively constant as TotER^{ITF} approaches 25.
### Key Observations
* The algorithms Prop.-c = 0.3, k_{max} = 10, Prop.-c = 0.3, k_{max} = 50, Prop.-c = 0.6, k_{max} = 10, Prop.-c = 0.6, k_{max} = 50, BMVDR, and OBLCMV all start with a high gSSNR gain and decrease rapidly as TotER^{ITF} increases.
* The algorithms BLCMV-η = 0.1 and BLCMV-η = 0.001 start with a lower gSSNR gain and decrease slowly as TotER^{ITF} increases.
* The algorithm JBLCMV has the lowest gSSNR gain and decreases rapidly as TotER^{ITF} increases.
### Interpretation
The chart illustrates the trade-off between gSSNR gain and TotER^{ITF} for different algorithms. Algorithms like BMVDR and OBLCMV initially provide high gSSNR gain but experience a decrease as TotER^{ITF} increases, eventually stabilizing. JBLCMV consistently performs poorly in terms of gSSNR gain. The "Prop" algorithms show a similar trend to BMVDR and OBLCMV, starting high and decreasing rapidly. The BLCMV algorithms start with a lower gain and decrease more gradually. This suggests that the choice of algorithm depends on the desired balance between gSSNR gain and TotER^{ITF}.